an analysis of the carbon costs of online tracking.
Authored by Fernando Cucchietti, Joana Moll, Marta Esteban, Patricio Reyes, Carlos García Calatrava.
[Barcelona, 16th of February 2022]
1. Abstract
Carbolytics is a project at the intersection of art and research by artist Joana Moll in collaboration with the Barcelona Supercomputing Center (BSC). The project aims to raise awareness and call for action on the environmental impact of pervasive surveillance within the advertising technology ecosystem (AdTech), as well as to provide a new perspective to address the social and environmental costs of opaque data collection practices.
Tracking users’ online behaviour has become a major business model in the last decade. Put simply, online tracking is the act of collecting data from online user activity, like reading the news, purchasing items, interacting on social media, or simply making an online search. It is known that tracking and recording users’ behaviour has become a major business model in the last decade. However, even though the societal and ethical consequences of abusive online surveillance practices have been a subject of public debate for at least a decade, the energy and environmental costs of such processes have been kept away from the public eye. The global data collection apparatus is a complex technological maze that needs vast amounts of resources to exist and operate, yet companies rarely disclose information on the environmental footprint of such operations. Moreover, part of the energy costs of data collection practices is inflicted upon the user, who also involuntarily assumes a portion of its environmental footprint. Although this is a critical aspect of surveillance, there’s an alarming lack of social, political, corporate and governmental will for accountability, thus a call for action is urgent.
The research behind Carbolytics identifies and analyses the carbon emissions of the total number of cookies belonging to the top one million websites. The investigation identified more than 21 million cookies per single visit to all these websites, belonging to more than 1200 different companies, which translates to an average of 197 trillion cookies per month, resulting in 11,442 monthly metric tonnes of CO2 emissions. This number reflects only browser-based cookie traffic and does not include other behavioural advertising tools, such as app tracking activity or profiling algorithms, so we estimate the actual number of emissions by tracking technologies to be dramatically higher.
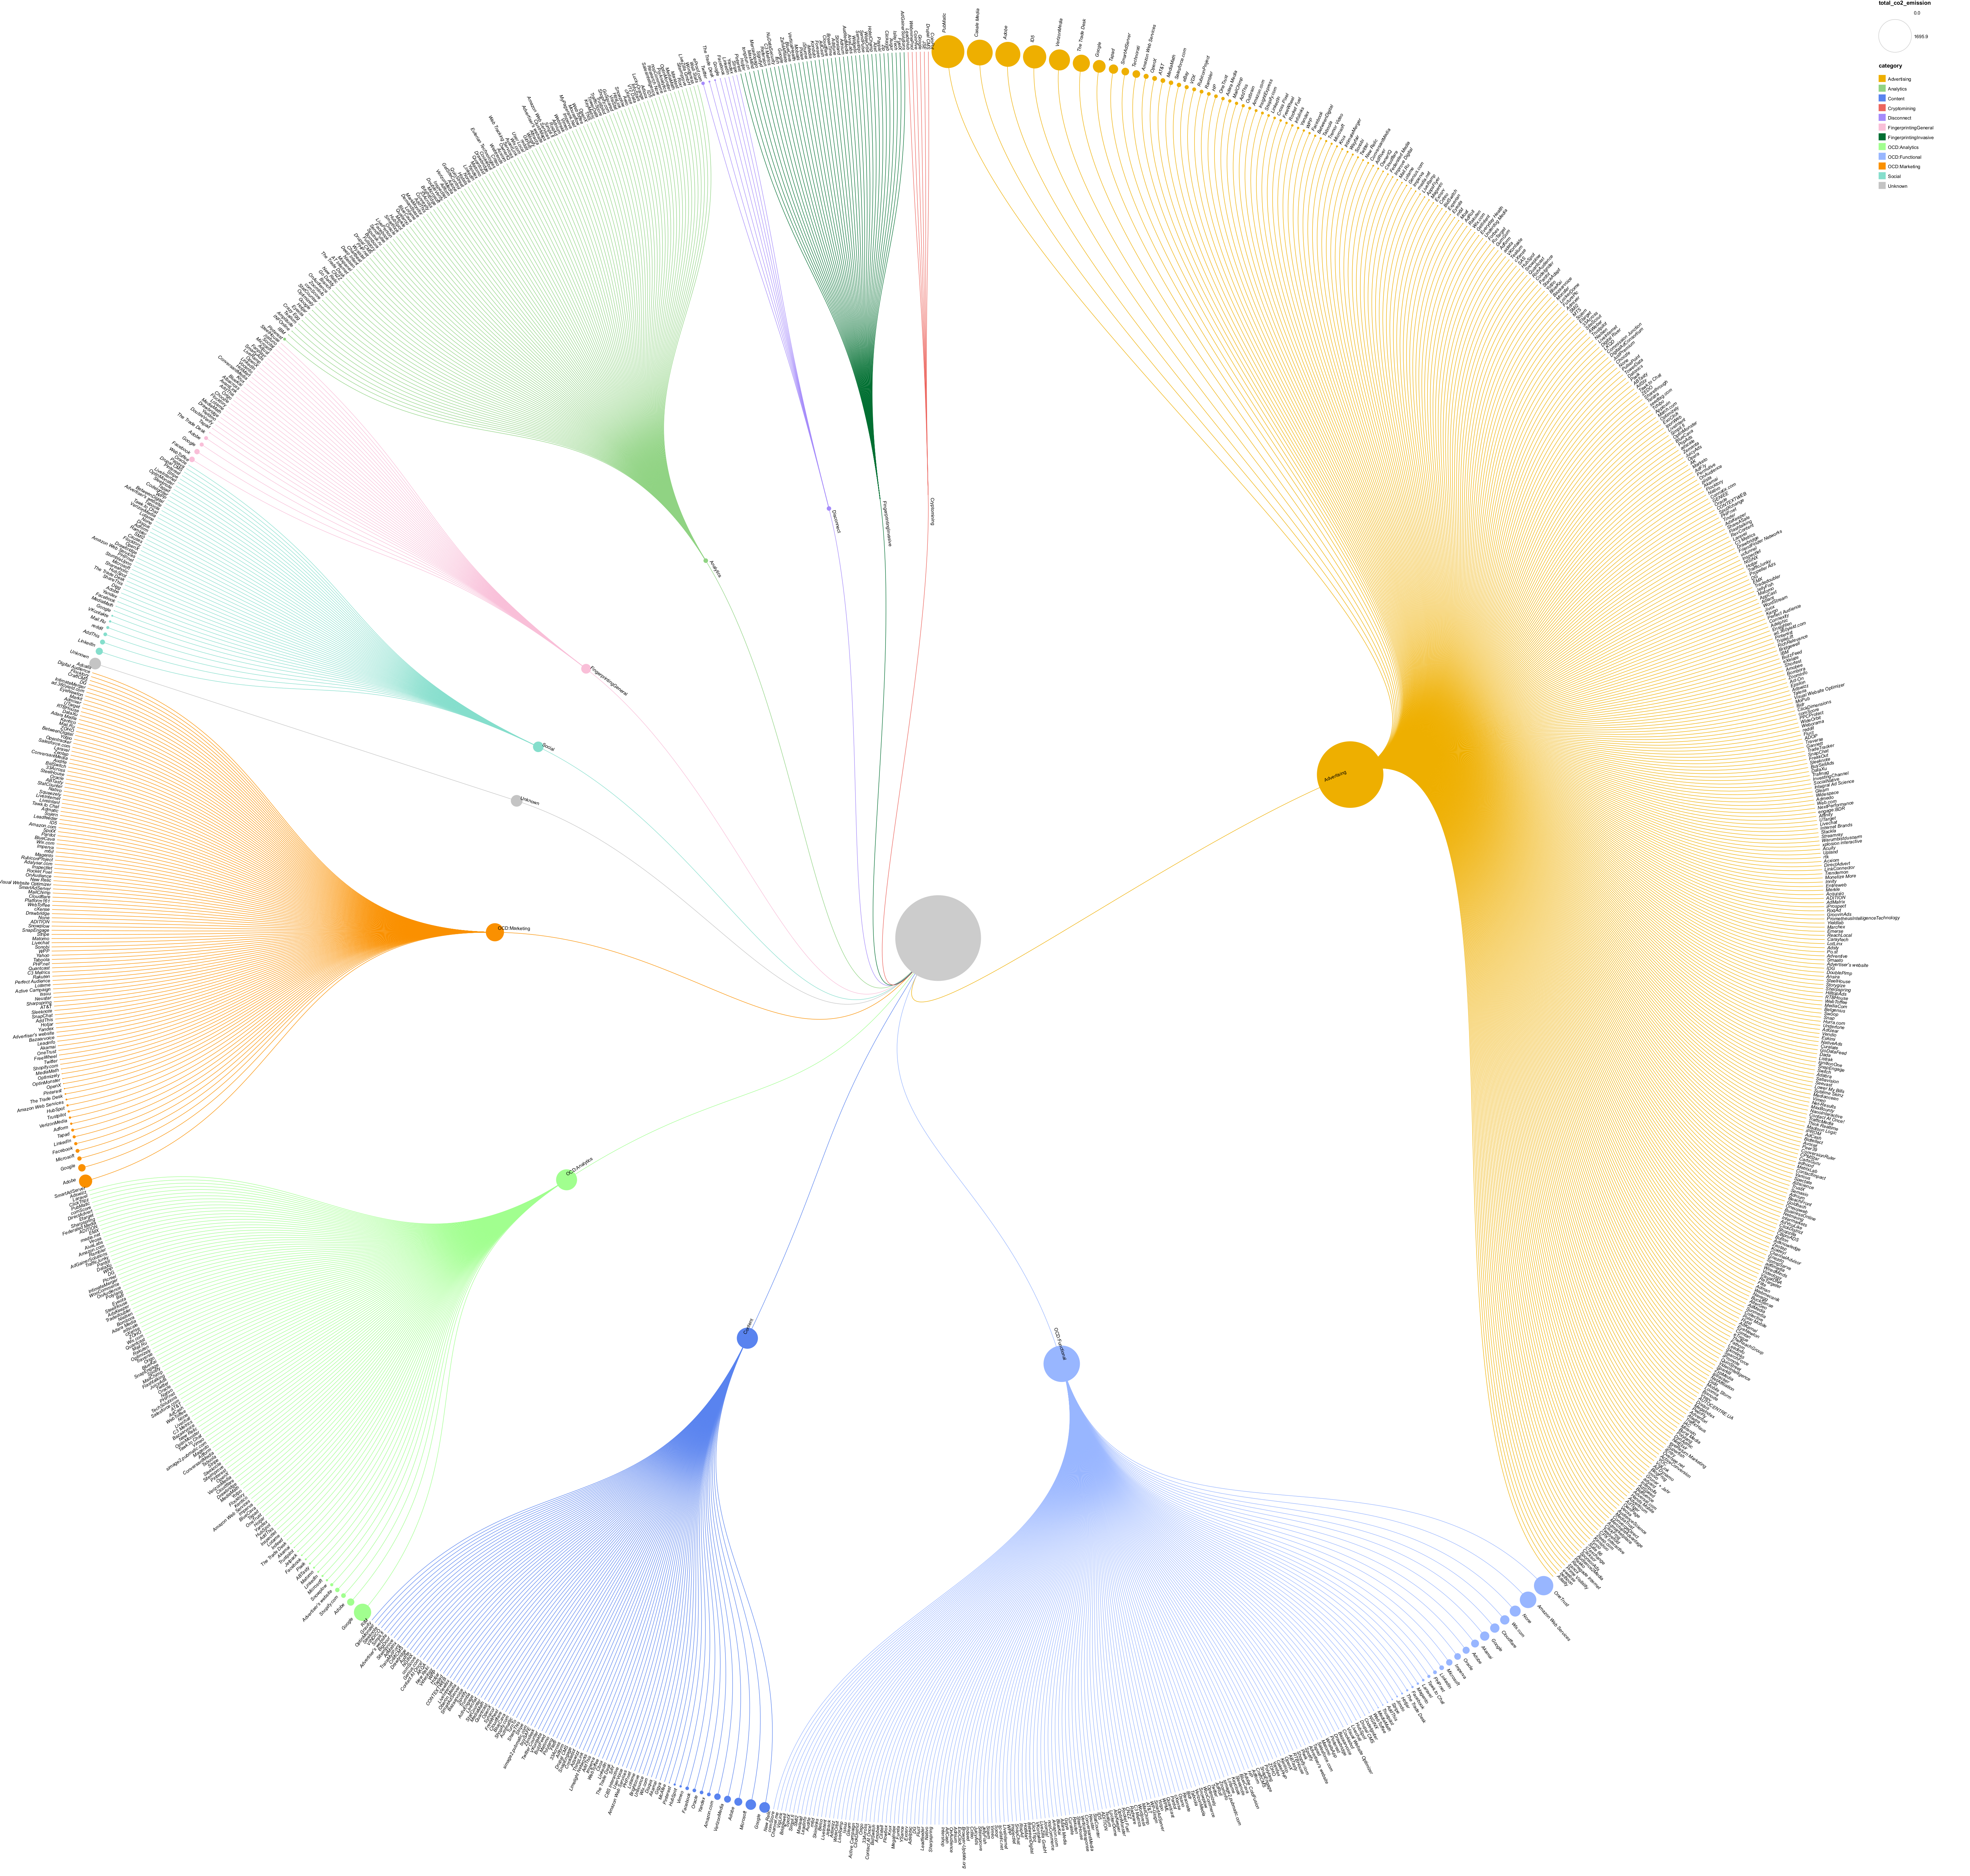
Figure 1a. Monthly metric tons of Co2 Emissions by category and organization
2. Introduction
AdTech is the primary business model of the data economy ecosystem or, in other words, the “money making machine that fuels the Internet”.[1] In 2021, the global ad spending across platforms reached $763.2 billion, and it is expected to rise 10% in 2022.[2] Moreover, in 2020, 97.9%[3] of Facebook’s and 80%[4] of Google’s global revenue was generated from advertising, and, excluding China, these companies, together with Amazon, will dominate 80% to 90% of the market in 2022.[5] Yet, despite the extraordinary importance of AdTech within the global economy, its methods and processes are extremely opaque, and thus incredibly difficult to control and regulate.
In a nutshell, AdTech analyses, manages and distributes online advertising. It encompasses a broad array of stakeholders, tools, and methodologies, such as ad exchanges, real-time bidding and micro-targeting, which rely heavily on user data in order to effectively target and deliver advertising. Hence, data collection is a key resource to the global AdTech supply chain. But how is user data actually harvested?
Typically, data is collected from a user’s device through cookies and other tracking technologies integrated into devices, web pages, apps, and all kinds of interactive and audiovisual digital content. Even though they are created and stored on the user’s device, tracking technologies are mostly non-transparent and sometimes undetectable to the average user, thus, making it relatively easy to extract large amounts of user data. Moreover, despite their “invisibility” and relatively small size, tracking technologies are responsible for triggering myriads of algorithmic processes at a global scale, exploiting user behaviour data with a direct impact on the user’s devices power consumption.[6]
The research behind Carbolytics identifies and analyses the carbon emissions of the cookies on the top one million most visited websites. The investigation identified more than 21 million cookies per single visit to the landing page of all these websites, belonging to more than 1200 different companies, which translates to an average traffic of 197 trillion cookies per month, resulting in 11,442 monthly metric tonnes of CO2 emissions. It’s important to understand that this number reflects browser-based cookie traffic and does not include app tracking activity, so we estimate this number to be dramatically higher.
Using this research, Carbolytics takes shape as an interactive web-based installation that shows the average global volume of cookie traffic in real-time. By introducing this analysis of climate and collective rights, Carbolytics seeks to add an often unexplored but critical layer to the traditional individual rights-based criticism of the AdTech industry, while providing strong evidence to inform the many communities that advocate for tech and climate change accountability.
Figure 1b. Screenshot of the artwork "Carbolytics" by Joana Moll. Available at: https://carbolytics.org
Highlights
[1] The carbon costs of the tracking cookie ecosystem from the top one million websites have been measured for the first time.
[2] The top one million websites contain a total of 21,805,649 cookies.
[3] Cookies are sent around over 198 trillion times per month.
[4] The most installed cookie in our sample list is _ga (Google Analytics), found on over 534 thousand sites.
[5] The first thousand cookies (the top 0.018%), by the number of sites they are installed on, cause a stunning 50% of all the emissions, and the top 1% of cookies (a little over 53 thousand) corresponds to 82% of emissions.
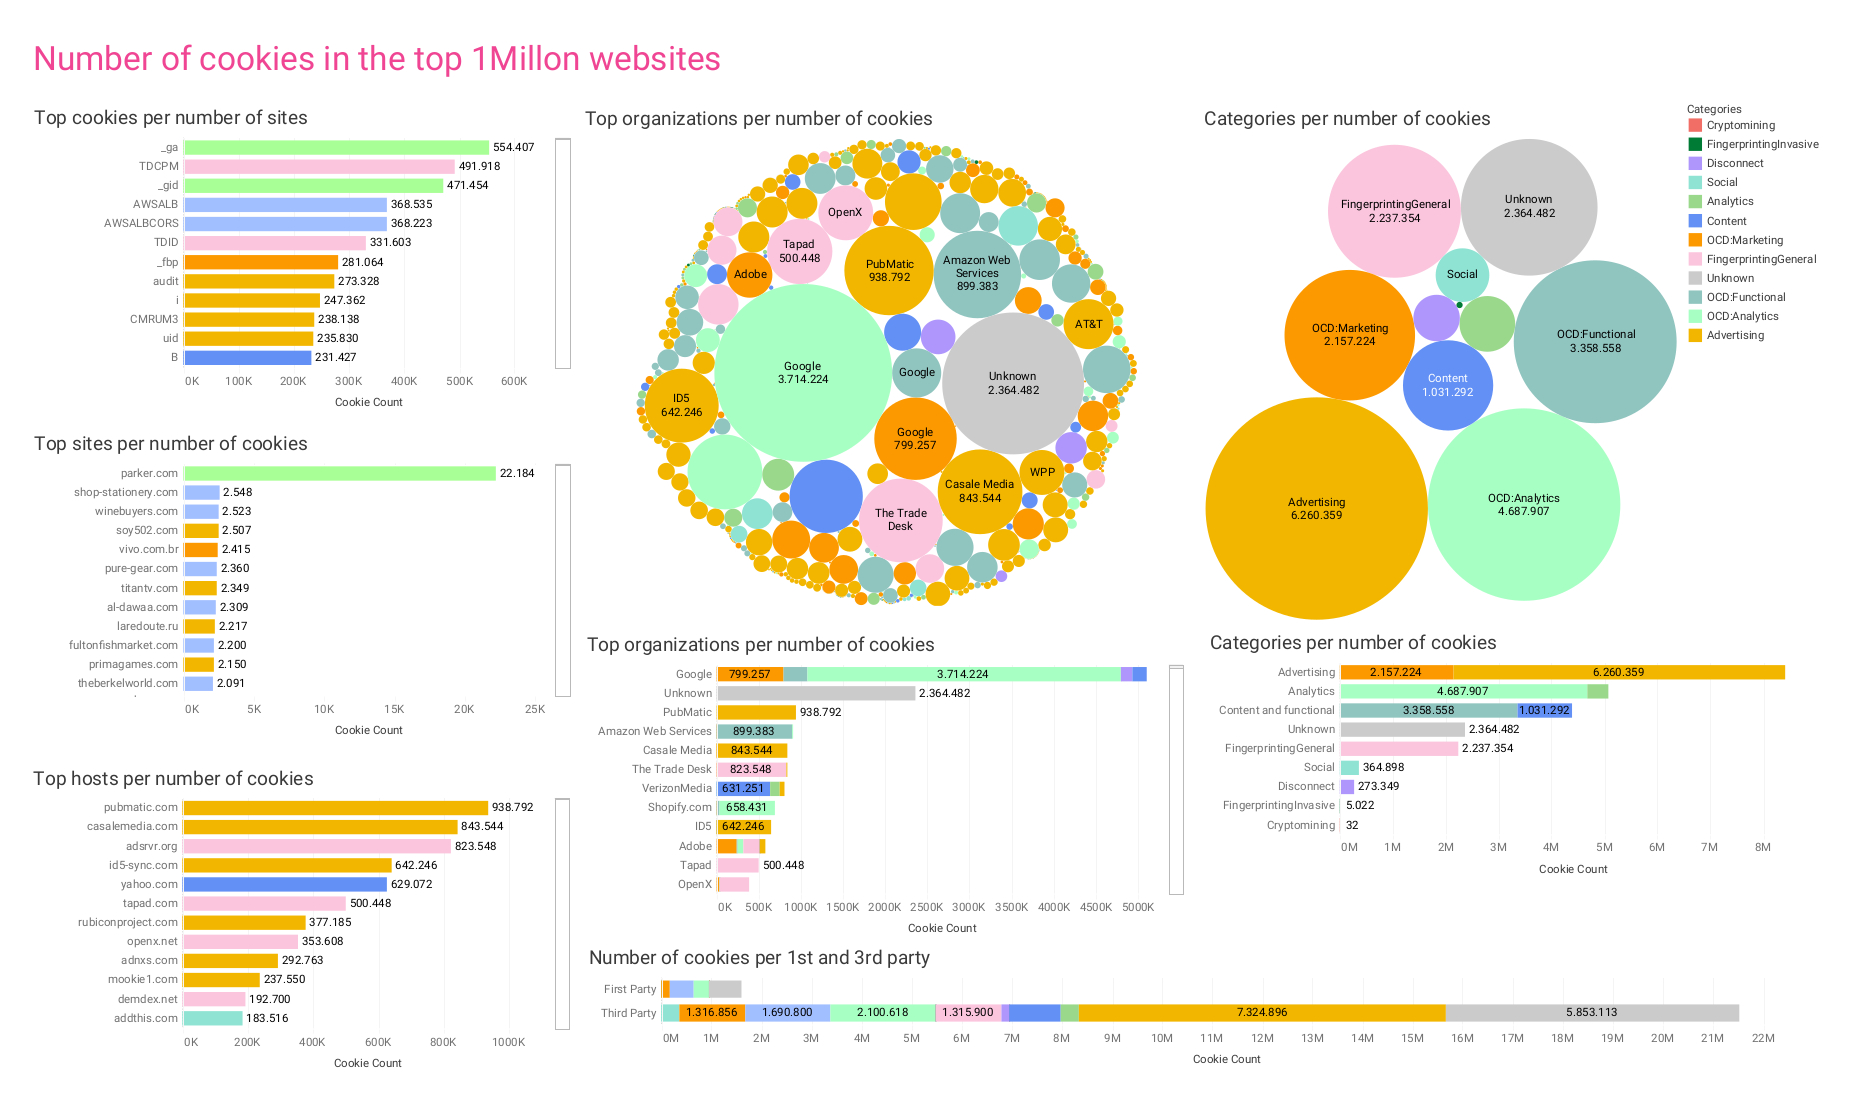
Figure 2a. Number of cookies in the top 1 million websites.
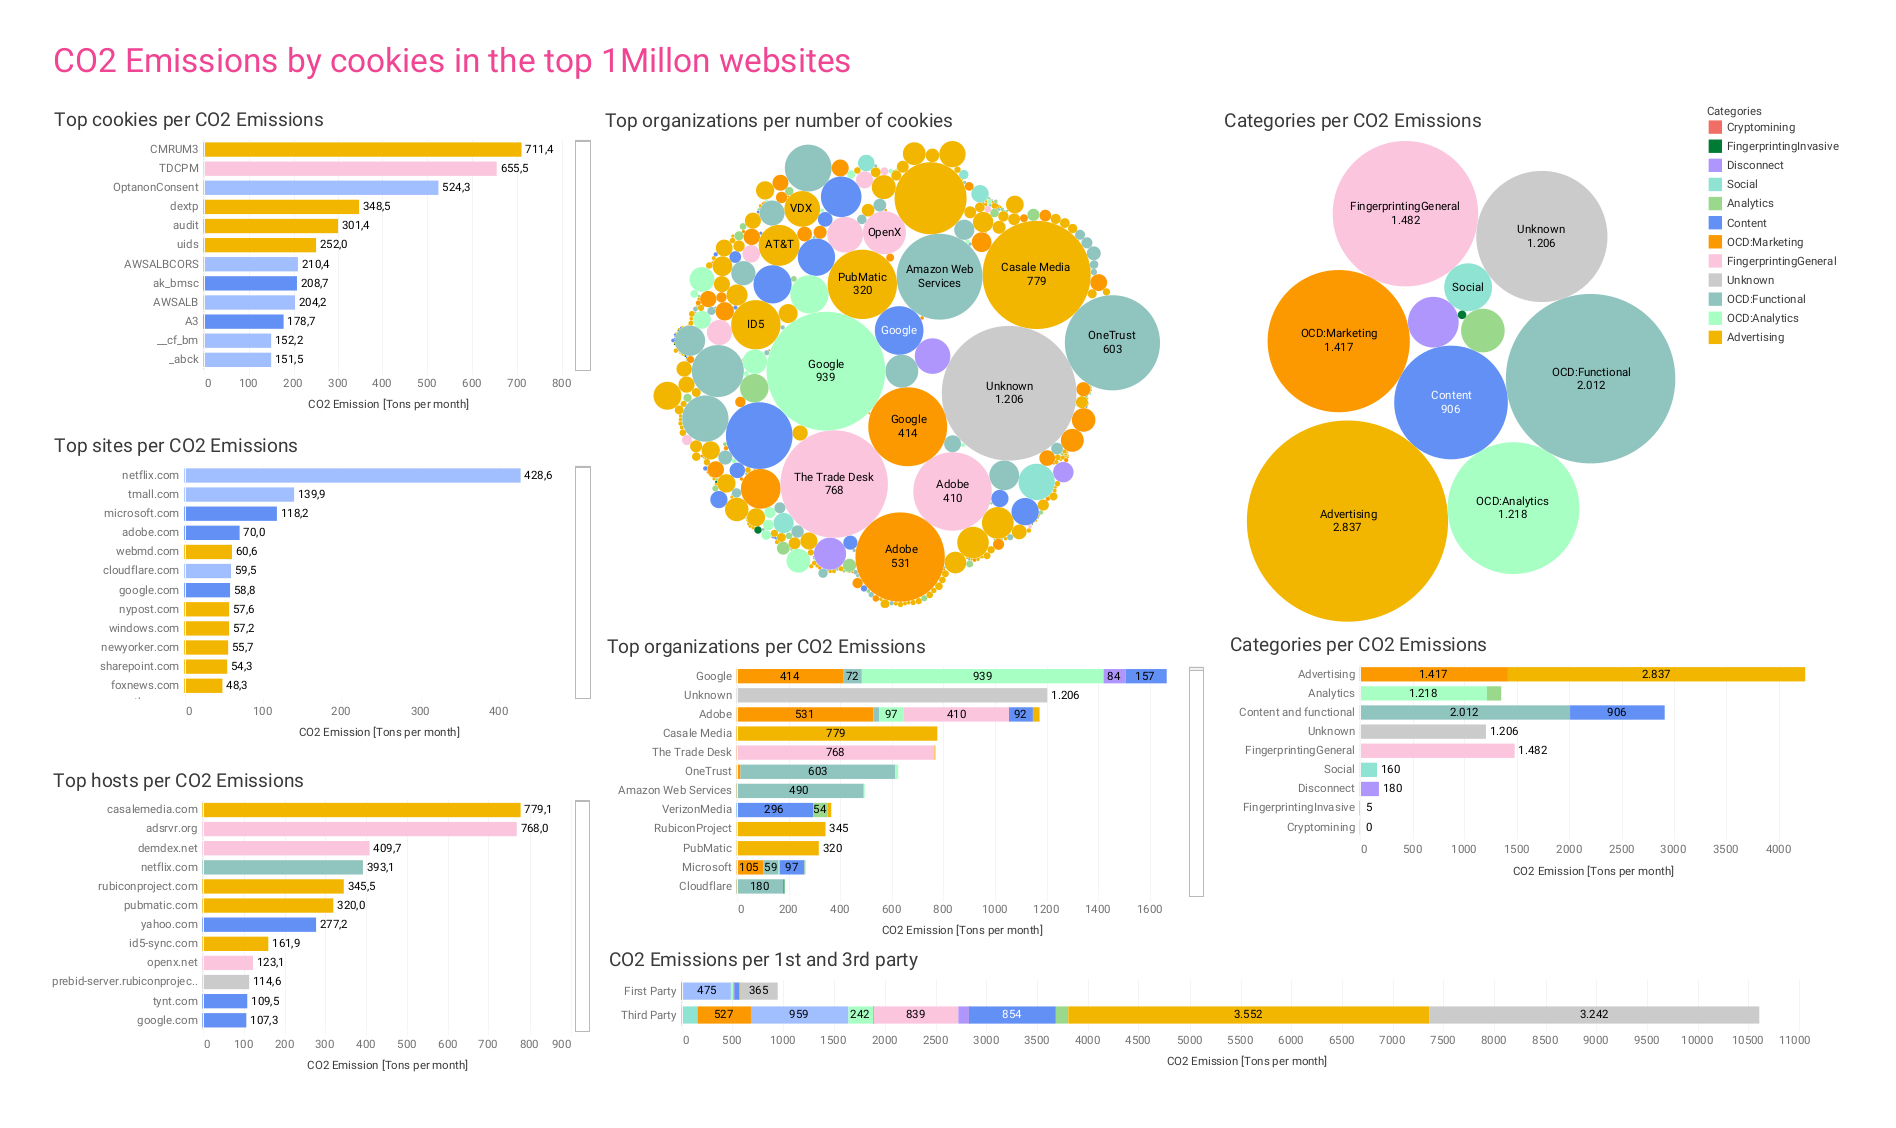
Figure 2b. Co2 Emissions by cookies in the top 1 million websites.
3. Background and related work
Cookies and Tracking Technologies
A cookie is a small text file stored on your hard drive by web pages you visit. The file – and the information in the file – is generated by the server-side application running the web site. The server also has access to the cookie it gave you (but not to cookies created by other websites).
Most cookies contain an ID used to identify you to a website. It doesn’t reveal personal information (because the data in the cookie came from the website’s server in the first place) – it only identifies you as the same browser that visited earlier, alongside whatever information the server asked you to store.
The server generates one cookie ID the first time you visit a site. It sends it to your browser, and your browser stores it. On subsequent page loads, the browser informs the server which of its cookies are currently stored and their value. The server reads them and thus can know that this is the same browser as before. In this way, websites can provide useful functionality, like remembering the items in your shopping cart or your personal preferences.
However, cookies are used in many large browser tracking schemes which create extremely detailed user profiles. Many websites use third-party ad networks, i.e. networks that span multiple sites. This allows central data aggregators to track user activity across many different domains. Cookies are not used to handle this tracking directly, but they do play a central role. In particular, cookies used for advertisement tracking are usually so-called “third-party cookies”, meaning that a cookie is installed by a website different from the one the user is visiting. For example, a user visits a news site that shows an image containing an advertisement. This image is requested from a different server, and this server can store its own cookie on the client. Using referrer information, or the information passed directly from the news site in the request, the advertisement server can identify the browser and build a user profile, more so if the user later visits another website that also pulls an ad from the same server (and is then identified directly with the third-party cookie).
Related Work
Interest in web tracking technologies has been growing in the last few years,[7] which has led many countries or regional governments to passing legislation that either limits usage or makes it more explicit. For example, the General Data Protection Regulation in the European Union[8] (known as the GDPR law) contains provisions on tracking technology that require all web sites to ask users for consent prior to installing cookies. The California Consumer Privacy Act[9] (CCPA), on the other hand, only requires that websites disclose what data is being collected and what is done with it, and provide some opt-out mechanism. Consumer Reports promotes the Digital Standard,[10] a framework for measuring consumer values like privacy, ownership and privacy in digital products, including methodologies for assessing how and how much information about their users a business is acquiring. Mozilla has created many technologies for improving privacy, including Lightbeam[11], a plugin for Firefox that visualizes HTTP requests between websites in real time to educate the public about privacy. Recently, Englehardt and Narayanan[12] measured the online tracking activities on one million websites, including cookie-based tracking as well as more modern, stateless fingerprinting techniques. They used their own web privacy measurement tool, OpenWPM, which we also use and is described in the methodology section below. They found a large amount of third-party cookies that belong to a rather small set of companies, in principle in charge of tracking and advertising. They also observed that, in general, news sites have the most trackers, that tracking protection is more effective than previously thought, and that websites have been (since as early as 2016) developing complex fingerprinting technologies that can complement or replace tracking by cookies. Finally, CE Delft recently performed a study on the environmental impact of tracking technologies in smartphones.[13] They found that tracking can take up to a double-digit percentage of the communication energy spent by phones. Based on the energy used by the network and data centres, the company estimates that the total carbon footprint of tracking data use in Europe is between 5 and 14 Mt CO2-eq. per year, and that approximately 60% of that is unwanted by the users – a staggering amount of emissions that is equivalent to that of European cities such as Turin or Lisbon.
4. Methodology
4.1 Site List
We chose to crawl the top one million most visited sites according to the Tranco list[14] – a meta-ranking that combines external rankings so that the result is more stable, comprehensive, coherent and resilient to manipulation. The underlying rankings are the Alexa Internet Top 1 Million (collected from Amazon’s Alexa browser extension), the Cisco Umbrella Popularity List (collected from Cisco DNS services) and the Majestic Million (a domain in-link popularity ranking based on the unique number of linking IP address subdomains). The three rankings are combined by applying the Dowdall system:[15] the first item in the ranking is awarded 1 point, the second one ½ points, the third one ⅓ points and so on until the last site in the ranking, which receives 1/N points (in this case, N equals 1 million). For each site, the points are added over the three rankings and over the last 30 days – the highest possible score is therefore 90 points for a site that is consistently ranked first on all three rankings every day. The Dowdall rule reflects the Zipfian distribution observed for website traffic where the exponent is equal to one.[16] We used the Tranco list from 1/9/2021, primarily because we were able to obtain the associated scores on that date for each site on the list, which we used to validate the estimation of traffic volume (see details below).
4.2 Crawling
Measurement configuration. Our main tools were OpenWPM, an open-source[17] web privacy measurement tool based on Mozilla Firefox, and Selenium, automation software that supports parallelism for speed and scale, as well as a comprehensive browser instrumentation. Under the GDPR online data privacy rules, users browsing from inside the Economic European Area must consent to the use of cookies on each site, which usually involves a modal window of some form where the user can click the “accept” button after configuring their preferences.[18] Because each site works differently, in general we cannot set up OpenWPM to accept these modal windows, which makes it difficult to collect cookie data from within European countries. In order to collect the most complete observational data, we used a Virtual Private Network[19] to situate our crawler in New York, USA. Our measurements were run on a workstation with an Intel Xeon Silver 4114 CPU with 64 GB of RAM and an M2 drive running on Ubuntu 16.04.7 LTS. We established a multi-container Docker application: for the VPN, a Gluetun VPN Client[20] container was set up and all Internet access was re-routed through it; the crawler was based on the OpenWPM project Docker container extended to read the Tranco list; and a PostgreSQL 13.4[21] container was used to consolidate the data obtained by the crawler. With this configuration we achieved a crawl rate of approximately 2000 sites per hour, allowing nearly real-time data analysis. A diagram of the complete workflow can be seen in Figure 3.The rate was selected based on performance and stability. The total amount of computation time needed for completing the one million list was about 500 hours, with an estimated emission of 35.6 kg of CO2 equivalent for this project.
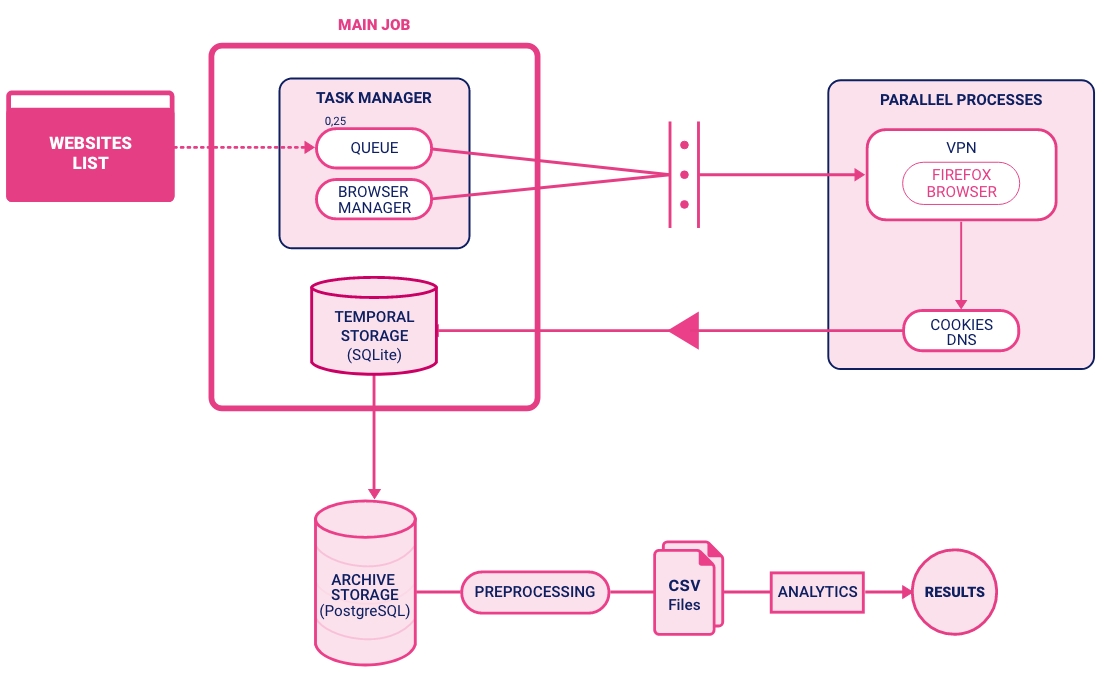
Figure 3. Schematics of the experimental configuration.
Estimating Emissions. We set out to estimate the emissions attributable to the transmission of the information contained in the cookies. This implies calculating how many bytes are transmitted for each cookie, how many times these cookies are sent between clients and servers, how much energy is required to transmit those cookies across the internet, and the emissions associated with the consumption of that energy.
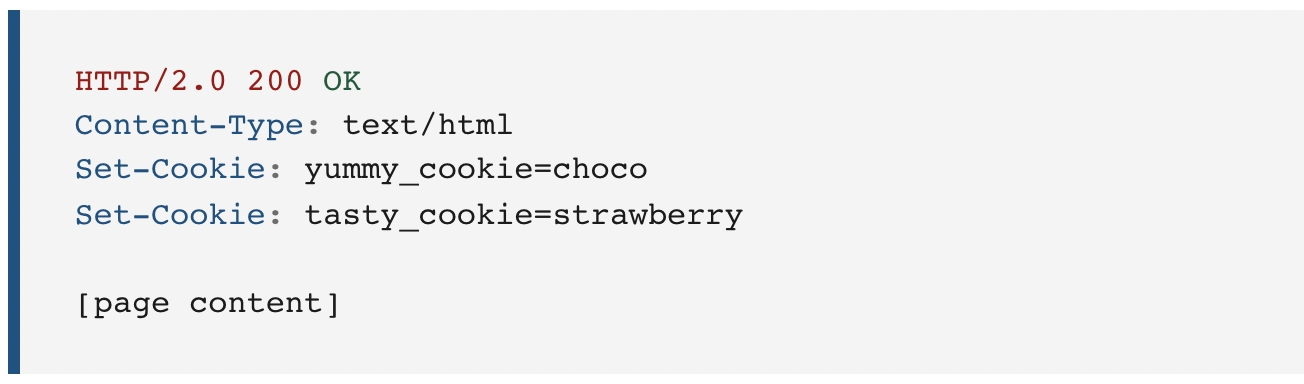
Byte traffic per cookie. When a person visits a page for the first time, the browser receives instructions from the server to install the appropriate cookies for this site, with two pieces of information: the cookie name and its value.

Updated Cookie Values
When a person visits a page for the first time, it receives instructions from the server to install the appropriate cookies for this site, with two pieces of information: the cookie name, and its value.
As described above, cookies are sent at least once from the server to the client, and then every time the client navigates to or visits the page. However, the server can respond to these requests by either updating the cookie value or simply repeating the previous value. This would be understandable, for example, if the user navigates through a webpage and the site uses the cookies to store session information. However, it can also happen due to tracking activities, such as a third-party cookie that is updated to reflect new information.
During the crawling process we observed that cookies updated their value many times on some sites, even if our crawler only loaded the home page of every site (on one site in particular, two cookies updated their values more than 22 thousand times!) and did not perform any other activity.
In order to estimate the traffic caused by cookies, we must then decide if we count the cookies only once, or do we register all the times we measured the cookie being stored and updated. In the first case, if we only count unique cookies, we obtain the lower bound for the traffic and the associated emissions. However, if we use the second method, the traffic generated by these cookies can be measured more accurately. The latter method was used throughout our project unless explicitly stated otherwise.
Estimating cookies in missing sites
As discussed above, we were not able to measure the cookies of some sites in the one million list from Tranco. The number of sites with issues was both small enough that we can either omit them or substitute them without significantly affecting the results and, unfortunately, large enough that were not able to complete it manually or by developing or testing a different measuring system.
In all the statistics aggregated by cookie or by cookie host, organization or category, we only included the data from the sites we measured directly. However, in estimating the overall emissions from the top one million most visited sites, we chose to also include the estimated size of the cookies (and their emissions) that we would find in the sites we could not measure – even if this added uncertainty to our estimates.
The estimation method is a simple statistical argument that leverages the millions of cookies we did measure successfully. From this measurement we created a very accurate probability distribution of total cookie size per site (it’s roughly a power law with exponent around 2), from which we drew estimated cookie sizes for the missing sites. We confirmed that the statistical properties of the distribution did not change after adding the synthetic cookies, which totalled about 5 million more (reaching about 27 million cookies that were used for estimating emissions) but added only 8.5±0.5% of the total emissions.
Traffic estimation
For each site, we needed to estimate the number of pages that the browser requested. The first step was to estimate how many total visits (i.e. not unique) each site received in a given period of time. Using a methology similar to that used to create the Tranco list, we estimated traffic volume using Zipf’s law with exponent equal to one: the second site in the ranking has one half the traffic of the first web site, the third site has one third of the traffic of the first site, and so on. Therefore, we can roughly estimate the traffic volume for all sites on the Tranco list by measuring only the traffic on the top site of the list: Google. According to Statista,[25] Google received 86.9 billion visits in June 2021, and 89.3 billion in December 2021 according to SimilarWeb.[26] Our starting point was the median value of these estimates, i.e. 88 ± 2 billion visits per month. However, cookies are sent to the same server for every page request, even within the same visit. We did not crawl inside the websites to measure the number of internal pages they have, and we were not able to find a model or systematic way to estimate how many pages users navigate in a single visit to the website. Instead, we used the average number of pages per visit reported for the top 100 sites in the US by Semrush,[27] i.e. 3.86 pages per visit. If we calculate the average for only 20 world sites using the same data from the same provider, the result is 5.74 pages per visit, and similar data but with less data points from SimilarWeb[28] give an average of 5.02 pages per visit. On the other extreme, a survey of 7443 sites found that the average was 2.6 pages per visit.[29] The standard deviation from these three datasets is 2.3, 2.6 and 3.3, respectively. Considering that many of the top one million sites have only one or two pages in total, we used the lower estimate of 3.9 ± 2.3 pages per visit, which makes it one of the most uncertain numbers in our project. Notice that we assumed that the same cookies from the landing page are used for for the pages within each website, which is most certainly not valid for all sites – the inner pages can have new cookies, with different cookie values (especially for session cookies), or no cookies at all.
Energy Usage of Internet Traffic
Estimating the energy consumption of internet traffic is a complex problem mostly because it is difficult to define the boundaries of the calculation, i.e. the parts of the system that participate in the transfer – and even then, some components can be hard or tricky to estimate[30]. Considering some parts or others can lead to a wide range of estimates that are orders of magnitude apart. For example, Aslan et al[31] analyse many studies to estimate an energy intensity of about 0.06 kWh/GB, but only for the IP core network and national access networks, leaving out part of the last mile or the home networking equipment, and user devices, which as they discuss is harder to assess. CE Delft[13] estimated the energy intensity of mobile phone traffic, finding a wide range depending on the technology: from 0.35 kWh/GB for 4G networks, 1.5 kWh/GB for 3G, and even 19 kWh/GB for 2G – stressing that emissions from mobile phone browsing will depend strongly on location as different regions of the world have varying degrees of penetration of each type of network. A key observation supported by Aslan et al [31] is that electricity intensity decreases by half roughly every two years, at least for the core network. Koomey and Masanet[30] report that Telefonica and Cogent, two large network providers, saw their energy consumption remain the same or halved (respectively) between 2016 and 2020, while traffic more than tripled. Masanet et al[32] estimated in 2018 that data centers consumed an aggregated of 205 TWh/year. Using an estimated global internet traffic of 1.38 EB[33], this translates into an intensity of about 0.14 kWh/GB, coinciding with a halving in two years estimate if we compare to the more recent (2020) study by CE Delft[13] that quoted the energy intensity of data centers at 0.072 kWh/GB. However, datacenters and centralized infrastructures might have economic incentives to reduce energy consumption that are much stronger than those of other components. Even if newer, better equipment is available, the rate of hardware renovation can be quite different for e.g. home networking or user computer devices. For example, the replacement rate of consumer desktop PCs in the US is between 5 to 6 years, and is expected to increase[34]. It is reasonable to believe that the replacement rate of hardware and its energy efficiency are worse in other parts of the world -- and many of those areas are where most of the new growth in number of devices is happening. We considered that for the purpose of this study it was crucial to include as much of the complete communication system as possible. Especially, that we should use estimates that include the energy used by user networking and computing devices. Coroama et al[35] argue against including end devices in estimations of energy intensity, underscoring that home user equipment energy usage varies wildly and includes difficult factors like being always on independent of traffic. Furthermore, they point that its inclusion can influence the result by up to one or two orders of magnitude. Nevertheless, in this project we set out to measure directly the cookie traffic coming in and out of these end devices, which imposes perhaps unwanted CO2 emission costs on the end users. For this reason, we strongly believe that they should be included in the estimation. We selected as our main source the study by Andrae and Edler[36] that estimated the energy consumption of communication technology using one of the widest system boundaries. On the downside, their study is from 2015, and some of their projections might have not been accurate. Nevertheless, their estimates for some components for which we were able to find more recent estimates is acceptable: For example, Andrae and Edler estimated the energy intensity for data centers as 0.06 kWh/GB and 0.05 kWh/GB for 2018 and 2020 respectively, quite close to the studies cited above (notice that they did predict a decrease in datacenter energy intensity, although not as strong as observed later on). For consistency, we used the full estimate of energy consumption (including data centres, telecom networks, and end users’ networking equipment, computers and mobile devices, but excluding their manufacturing emissions) as estimated for 2021 by Andrae and Edler, and divided it by the total internet traffic estimated by Cisco, which gave us an average energy intensity of 1.8 kWh/GB. Andrae and Edler estimate a lower bound of 1.1 kWh/GB and a higher bound of 2.7 kWh/GB. Since their original study is from 2015, we consider that their estimate could at worst be reduced by a factor 8 in 2021, and the final estimate could be as low as 0.23 kWh/GB.
It is important to remember that estimating energy intensity of all the internet communication system is a complex problem, and that there are no definitive answers. Even when reporting accurate, measured numbers, energy consumption studies will be limited by the boundaries and assumptions they define, and by the access to mostly proprietary information they can gain (e.g. incomplete information about datacenters around the world, partial or distorted data coming from telecommunication companies, and other reasonable “best-effort” like data sources). In many cases, one might feel that the whole endeavor is somewhere between an actual measurement and a Fermi estimate[37] aimed only at figuring out the order of magnitude of the problem. This is also evident in that many the cited studies fail to provide a quote of the uncertainty around their estimates. But this is ok – such a complex and dynamic system is inherently alive and changing, and obtaining orders of magnitude can help detect trends and, most importantly, decide if this is a problem worth the effort of solving or prioritizing over others.
Carbon Intensity of Electricity
We used the international average estimate by the International Energy Agency of 475 grams of CO2e per kWh.[38] However, we should bear in mind that carbon intensity varies greatly by country.[39] We were not able to find the uncertainty range in these estimates.
As an alternative to using an overall number for all servers, we considered re-evaluating the carbon intensity of cookies that are served from data centres that rely on renewable energy. In those cases, energy intensity can be as low as 3 grams and as high as 100 grams of CO2e per kWh.[40] However, obtaining information about which site is hosted on a renewable energy server is not straightforward. For this alternative estimate we relied on the list compiled by The Green Web Foundation.[41] We observed that the number of sites not listed as using renewable energy goes up as we go down in the ranking by traffic, which could mean either that less visited sites do reside on less advanced servers, or simply that these sites are not known enough to appear in the green list. We did not find any information on the energy source of over 690 thousand sites. Furthermore, as we were not able to obtain first-hand sources for average equivalent emissions of renewable energies, we can only rely on the estimate of 33.4 g CO2/kWh that Web Site Carbon[42] quoted as the wind energy emissions reported by the company Ecotricity.[43]
4.3 Assigning categories and/or organizations
We classified the cookies by its owner organization and purpose category based on two sources:
The main classification is based on the Tracker Protection lists provided by Disconnect Me.[44] Each cookie was assigned to a category and organization according to its domain. The cookie inherits the category and organization that Disconnect Me assigned to the domain.
We also performed a secondary classification according to the cookie name based on the Open Cookie Database repository[45] which classifies the cookies into four categories: Functional, Preferences, Analytics, and Marketing.
Even though this method is regularly used to classify cookies,[46] it is prone to errors. For example, if the cookie name cookie_a is listed in the database as belonging to Company A, it will be assigned to Company A even if the domain is companyb.com, indicating that Company B is simply using a cookie with the same name.
5. Results
Crawling
Our crawlers ran successfully on 764,723 websites, measuring a non-zero number of cookies on 709,486 of them. We downloaded a total of 21,805,649 cookies. We removed the cookies that were stored multiple times because the server requested an update of the value by grouping the cookies by visit id, host and the name of the cookie, and kept the most recent value by timestamp. With this process we obtained a total of 12,328,094 unique cookies.[47] According to our traffic estimates, the top one million sites on the Tranco list are visited approximately 1,295 billion times per month, and the cookies in those sites are sent around over 198 trillion times.
Noticeably, we repeated the measurements informally on a random selection of sites, and we observed a few variations in the number and specially in the value of cookies stored, which could indicate that the whole experiment should be repeated periodically to understand the variability and possible trends of cookie usage.
Of the remaining 235,277 websites where we couldn’t measure cookies, 87,947 did not respond, 85,082 had DNS issues, 24,372 returned HTML 4xx client errors, 13,581 gave SSL-related errors, 5,726 gave HTML 5xx server errors, and others gave miscellaneous errors. Such behaviour is similar to that observed by the creators of the OpenWPM framework, although our error rate is approximately three times larger than theirs. We manually inspected a random selection of 300 sites and confirmed that over one third of the problematic sites did not respond or no longer existed. We attribute this in large part to fixing the Tranco list to a few months old version (for reasons related to the estimation of the traffic per site). The other errors were largely a combination of our configuration of the crawler, due to which it could not handle redirections correctly, issues with the SSL context, and location issues (e.g. some sites unreachable from our VPN in New York City seemed to load correctly from Europe or Asia).
Usage of Cookies
The median cookie size (byte length of its name and value) was 35 bytes, with 21 bytes and 63 bytes in the 25% and 75% percentile. Cookies are limited to 4096 bytes, and, as expected, the number of cookies on that extreme size was small (see Figure 3). Websites have a median of 7 cookies, with a mean of 27. The total length of these cookies per site has a median of 312 bytes and a mean of 1880 bytes. Both distributions are heavy tailed (see below).
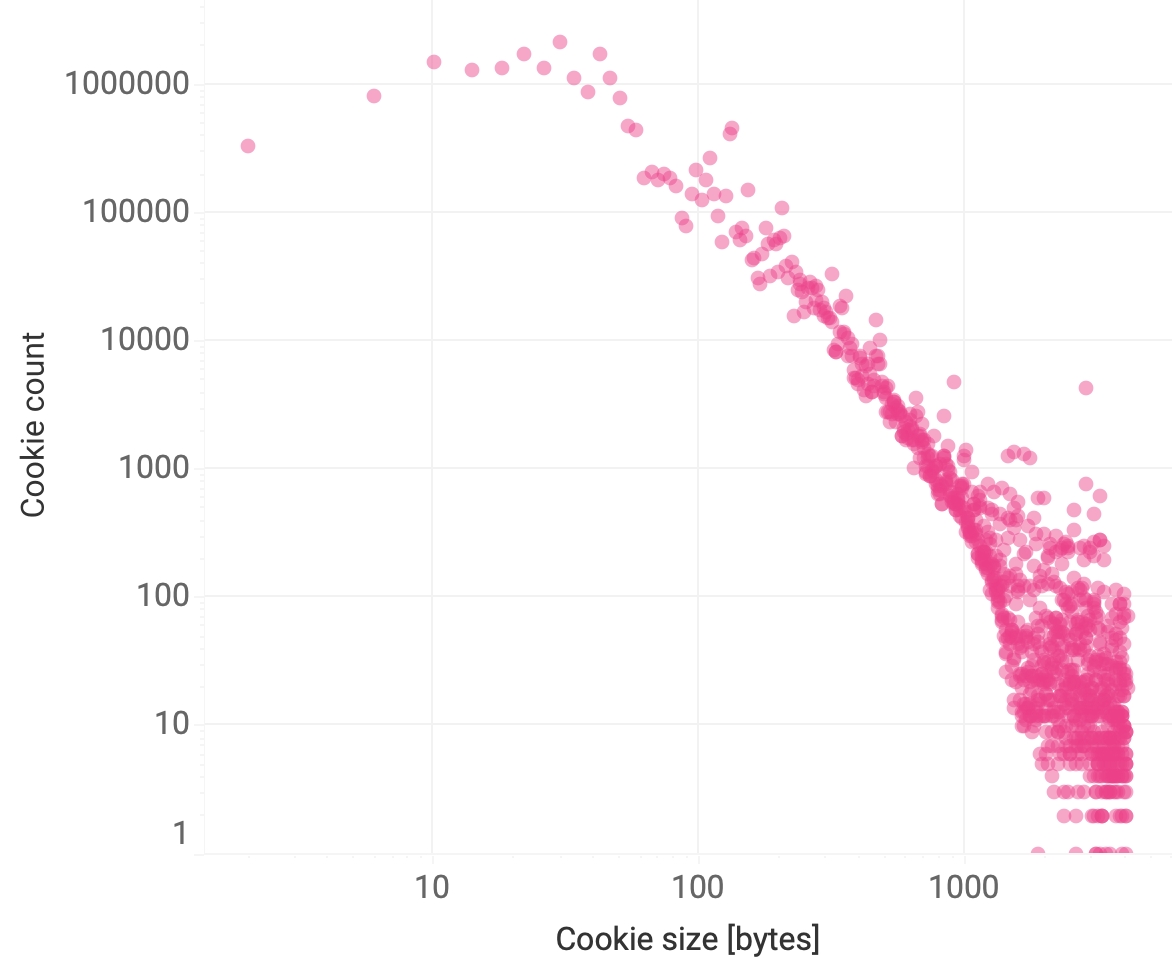
Figure 4. Histogram of the size of cookies. Because of the logarithmic scale, cookies of size zero are not represented. The maximum size of a cookie is 4096 bytes.
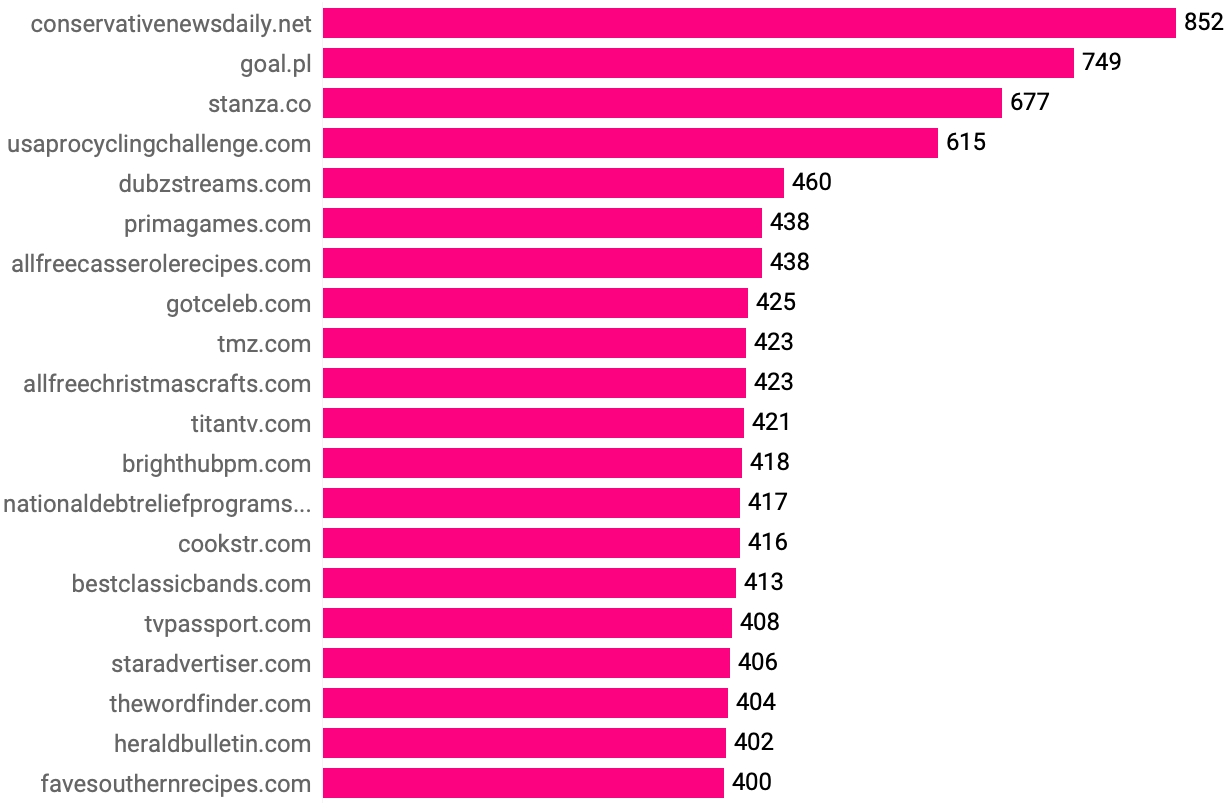
Figure 5. Number of unique cookies found on the top one million websites, ranked (top 20).
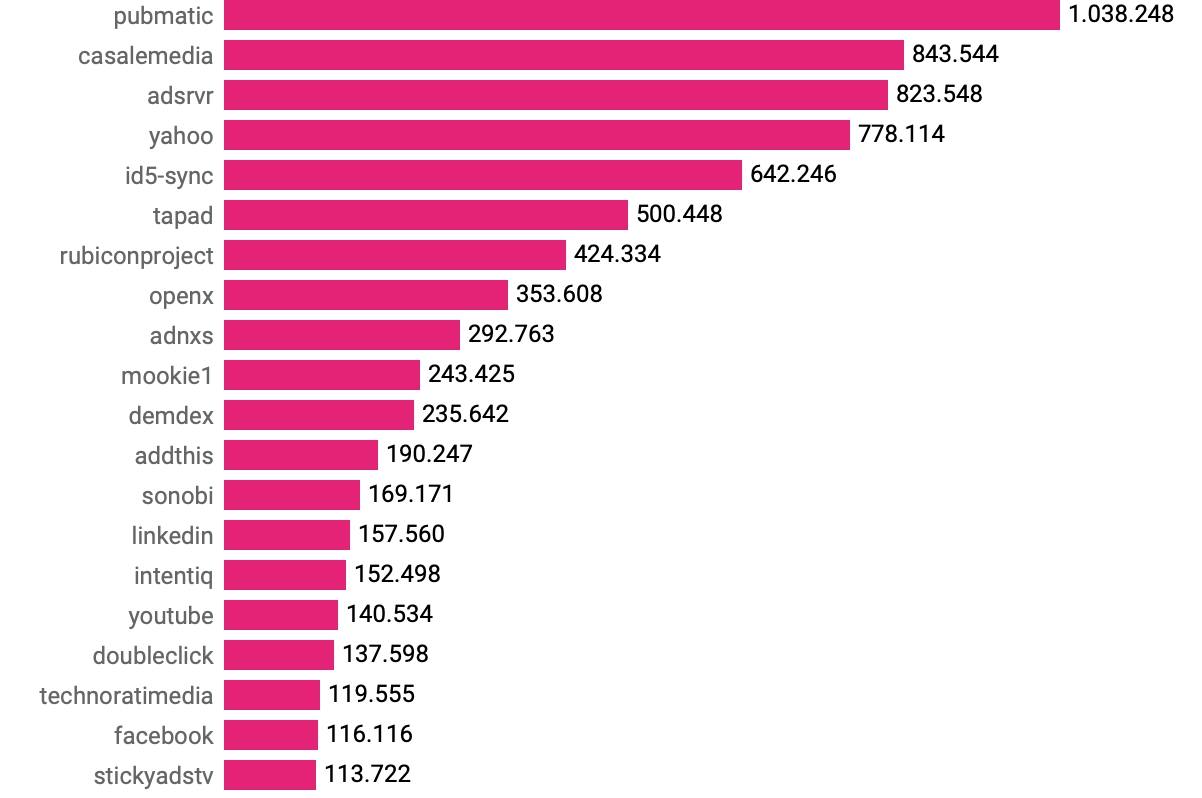
Figure 6. Number of unique cookies found by host, ranked (top 20).
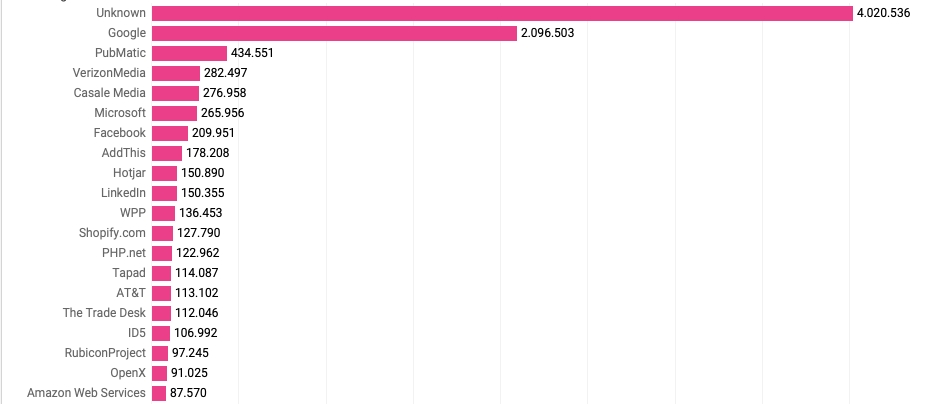
Figure 7. Top 20 organizations that own cookies. The top row indicates that we were not able to assign ownership for over four million cookies.
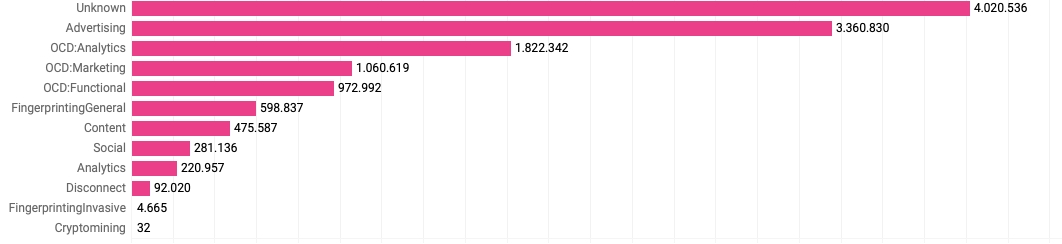
Figure 8. Number of cookies found by category.
Estimation of Missing Sites
Even if we could not explore the missing sites, they do or did exist, or at least there are surely others similar to them in terms of traffic. In order to get an estimate of the overall emissions due to cookies, we filled in those missing data by randomly drawing a total number of cookies and total accumulated size of cookies from the observed data, with replacement. In other words, we used the observed frequency histograms of cookie count and size (see Figures 9 and 10 below) as a probability distribution to draw from.
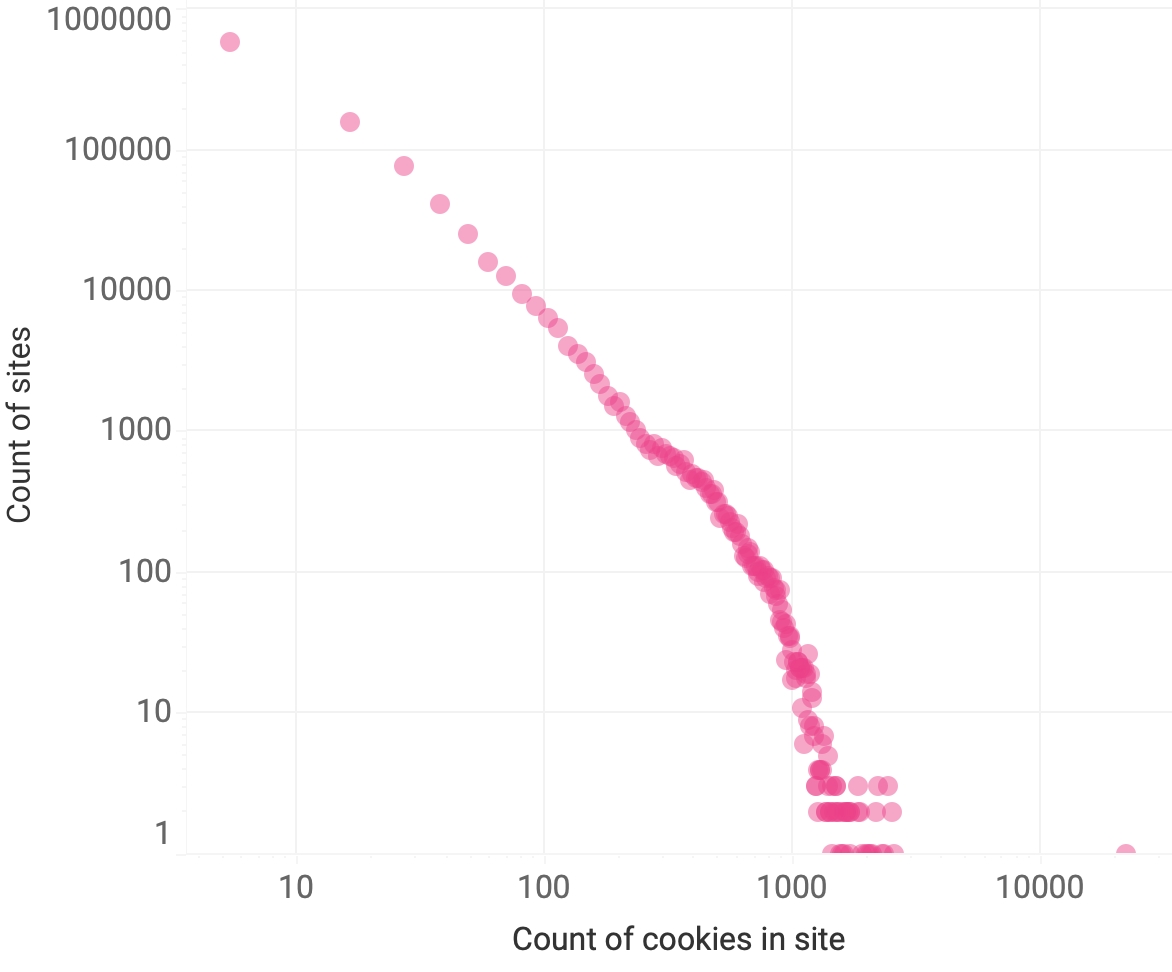
Figure 9. Histogram of the number of cookies found in the crawled websites. The outlier on the lower right is perhaps a glitch on the server or in our crawler, and corresponds to two cookies whose values were updated over 22,000 times, which we registered as cookie-related traffic.
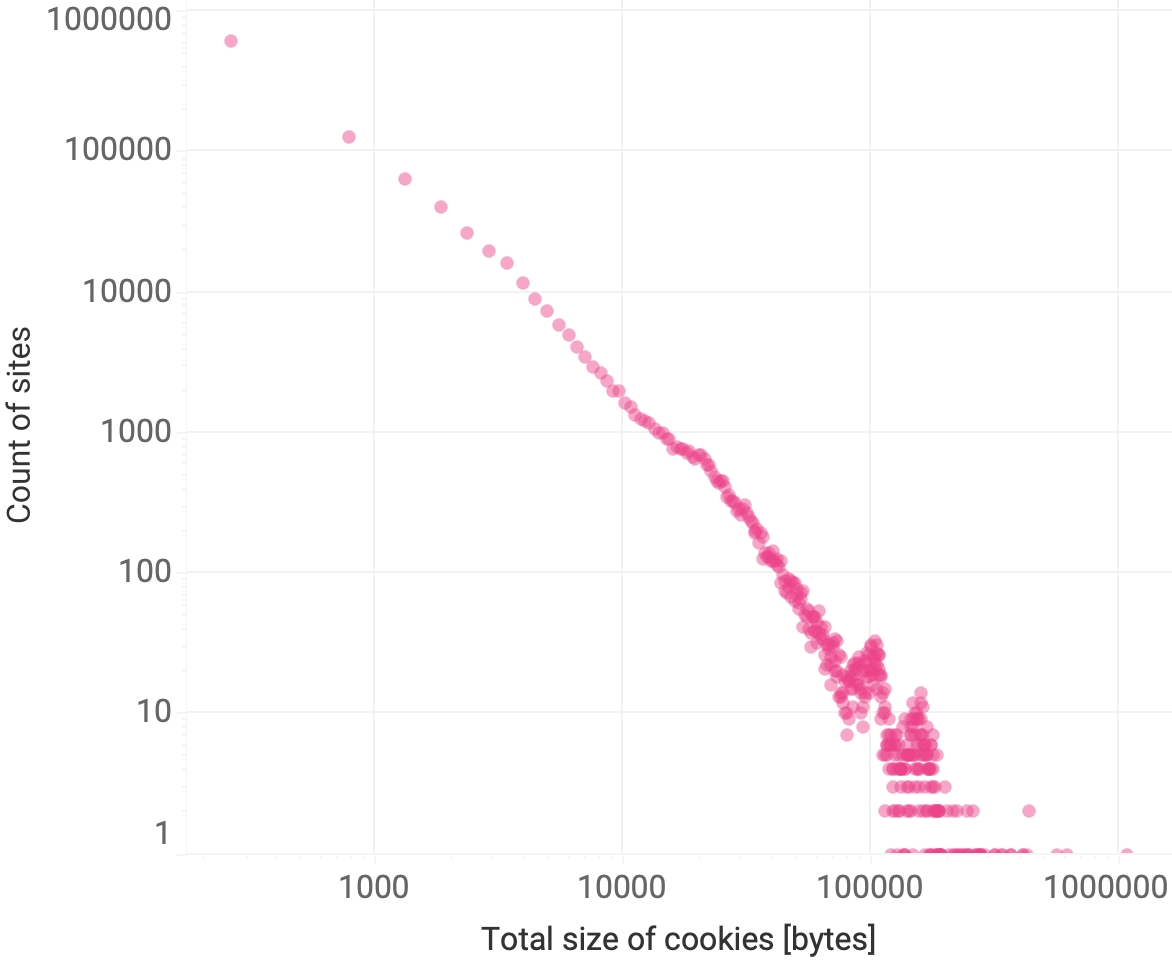
Figure 10. Histogram of the accumulated size of all cookies found in the crawled websites. Notice that many sites have several kB of cookies. The site count decays with a power close to 2.
Estimation of Emissions
Emissions per site
Using all the above results, we computed that all the cookies from the one million sites on the list are responsible for 11,442 metric tons of CO2 per month (10,469 tons if we subtract the estimated sites). Considering conservatively the uncertainty ranges from all the sources we used, we estimate a lower bound of 1,400 and an upper bound of 17,100 metric tons of CO2 per month.
The top site in our ranking is netflix.com, followed by tmall.com and microsoft.com. It is interesting that some sites should be aggregated, as they are simple variations of the original domain for different countries or for capturing typos or products of the same brand. However, we currently have no method of grouping them together consistently. The top 20 sites by emission from cookies are shown in Figure 11.
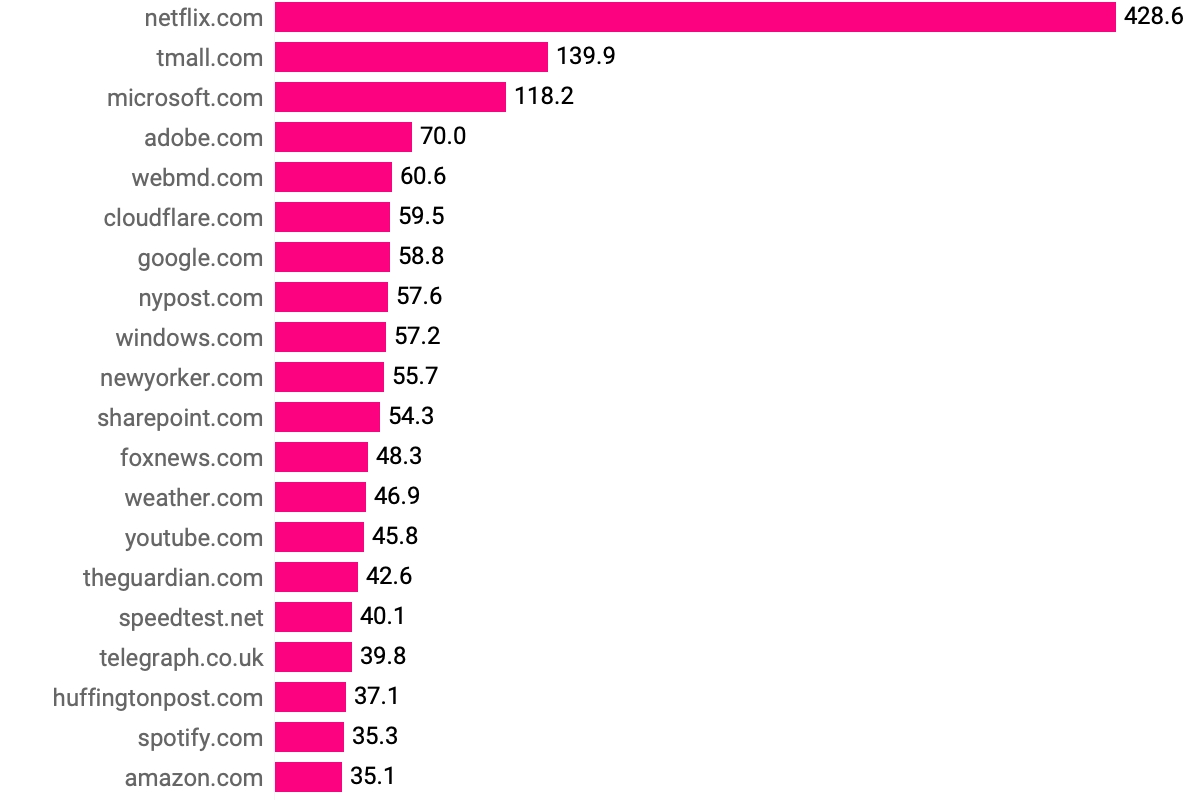
Figure 11. Emission of CO2 (in metric tons per month) generated by cookie traffic for the top 20 sites.
Many tracking cookies are used across different sites, but they are easily identifiable because they are served from the same host and have the same name. A coincidence of those two ensures that the cookie is unique and we can count the sites where it is installed. With this grouping, we obtain a ranking of cookies by the number of sites they can be found on (see Figure 12).
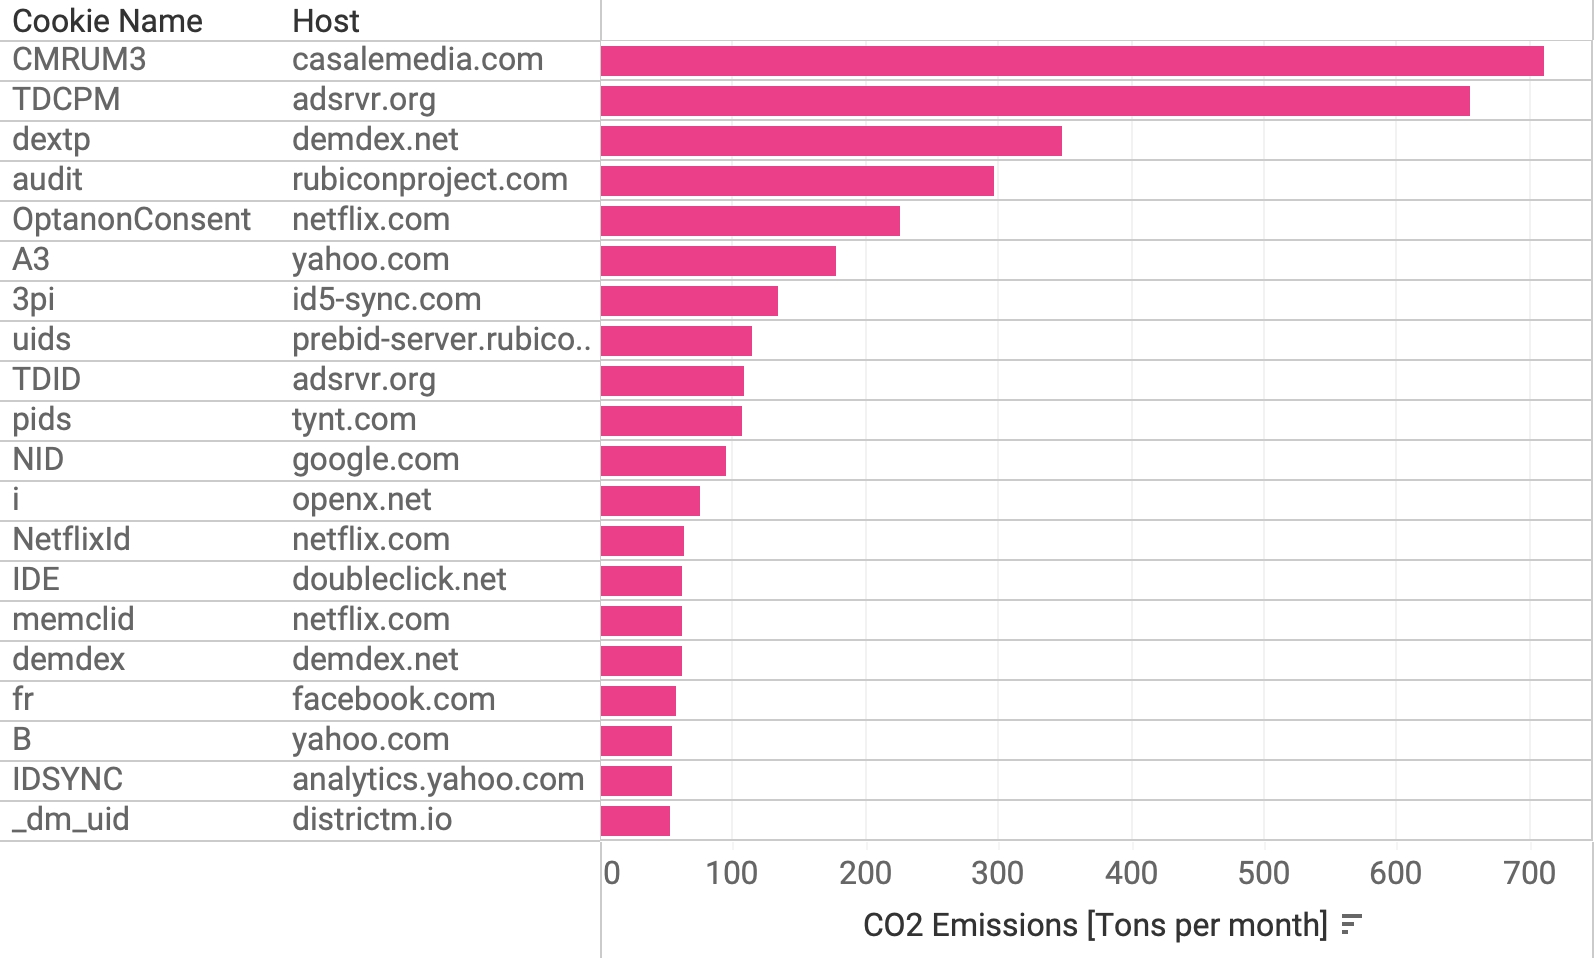
Figure 12. Estimated emissions of CO2 by the top unique cookies (combination of host and name).
Another, inherently less accurate method of identifying unique cookies is to group them by name. This clearly does not work for common names like uid (for user identification), but can nevertheless give us some clues for well-known and strangely named cookies (see Figure 13), such as Google Analytics cookies _ga and _gid, or the Facebook cookie _fbp. Indeed, with this aggregation we can tell that the most installed cookie in our sample list is _ga on over 534 thousand sites, followed by The Trade Desk’s cookie TDCPM, and then again by Google’s _gid, followed by cookies that are most likely from Amazon and Facebook. However, the number of sites where a cookie is installed is not directly proportional to emissions, as these are related to traffic (see Figure 14)
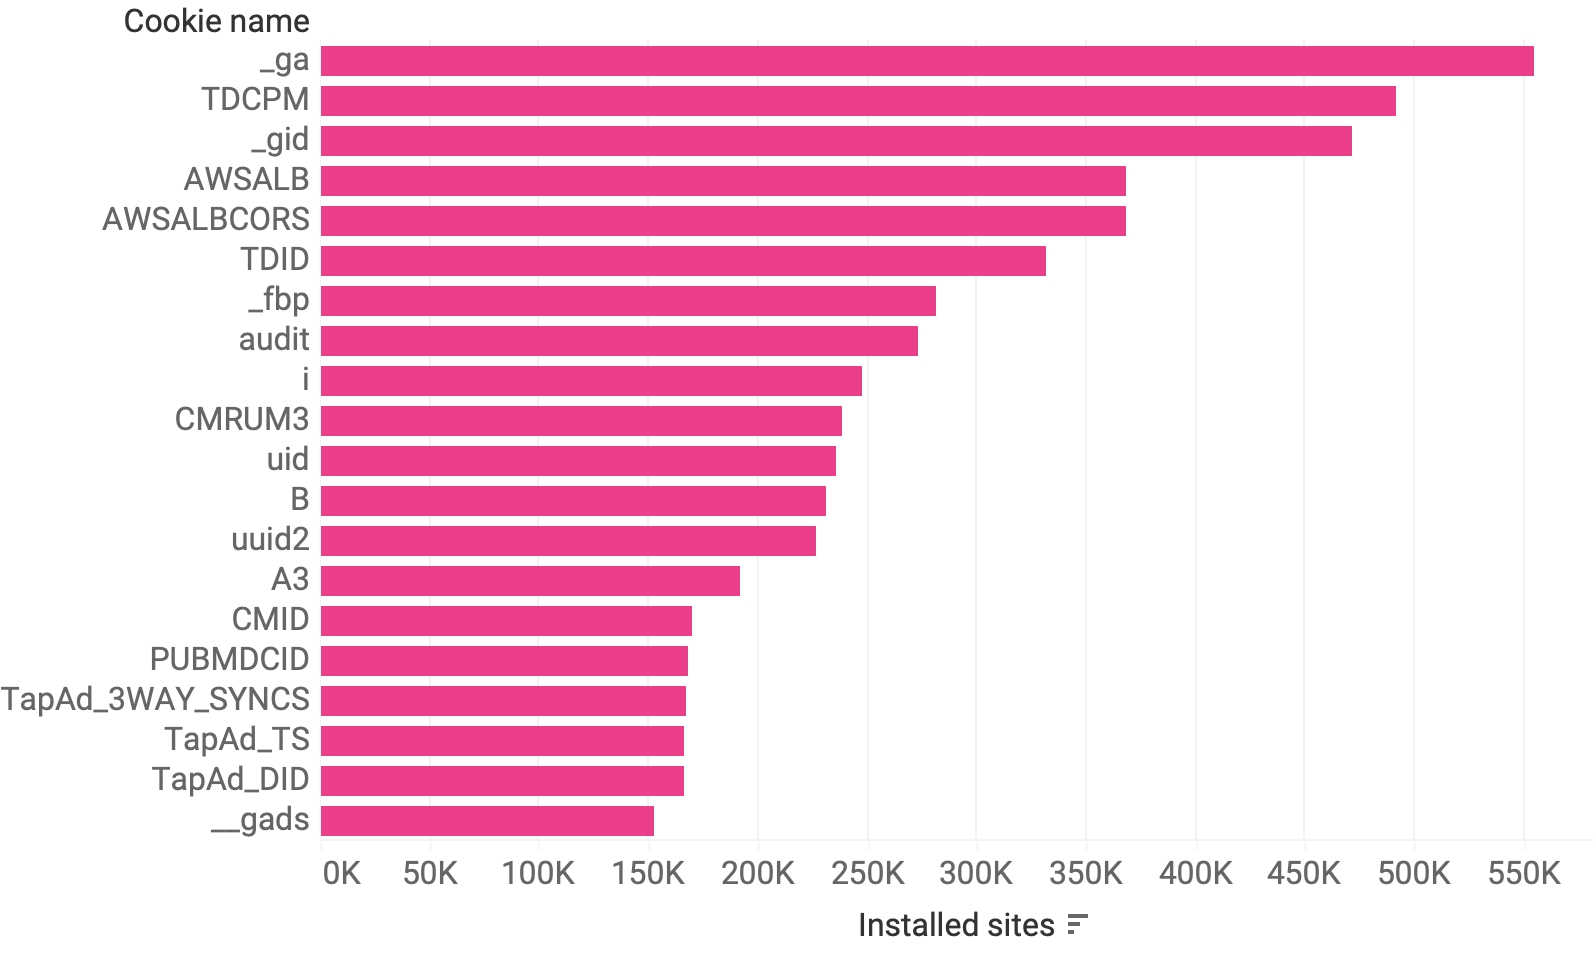
Figure 13. Top 20 cookies with a unique name by the number of sites where they are installed. Notice that this does not prevent distinguishing two cookies from different owners that are named the same.
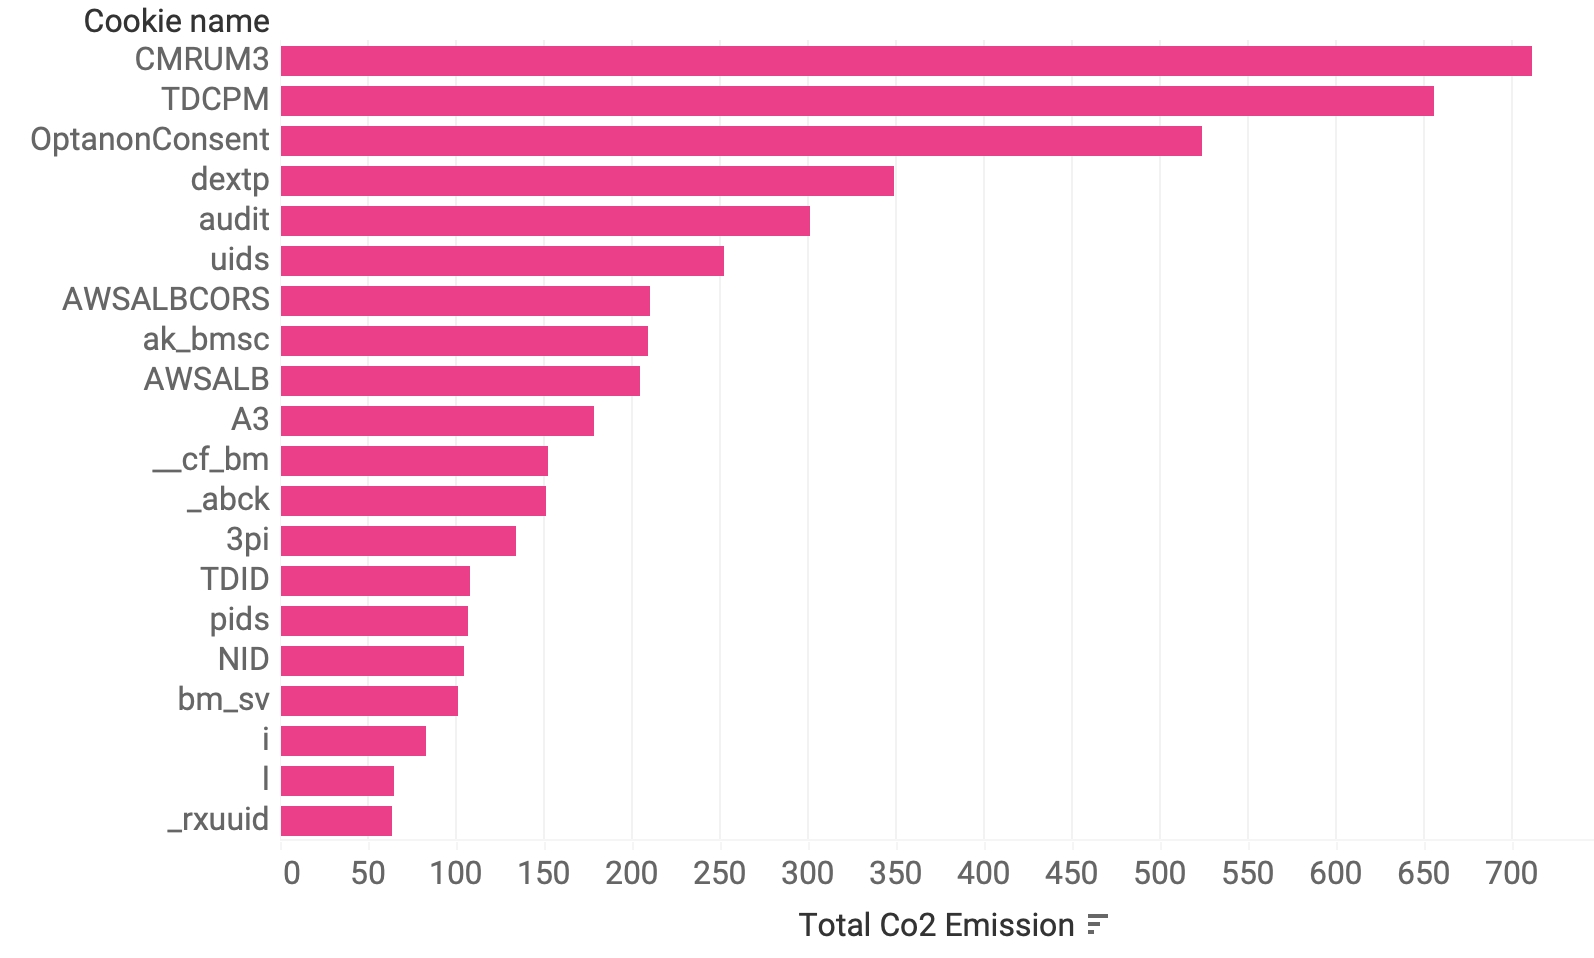
Figure 14. Top 20 cookies with a unique name by CO2 emissions. Notice that this does not prevent distinguishing two cookies from different owners that are named the same.
The cookies we found came from 908,358 different hosts (Figure 15), and were able to assign the cookies to over 1200 organizations (Figure 16). Of the top five hosts responsible for emissions (Casale Media, adsrvr.org by The Trade Desk, demdex.net by Adobe, Netflix and the Rubicon Project – now Magnite), only one, i.e. Netflix, is not an online advertising company. This reading could be biased because the sources we used to identify organizations have a vested interest in identifying mainly online tracking companies.
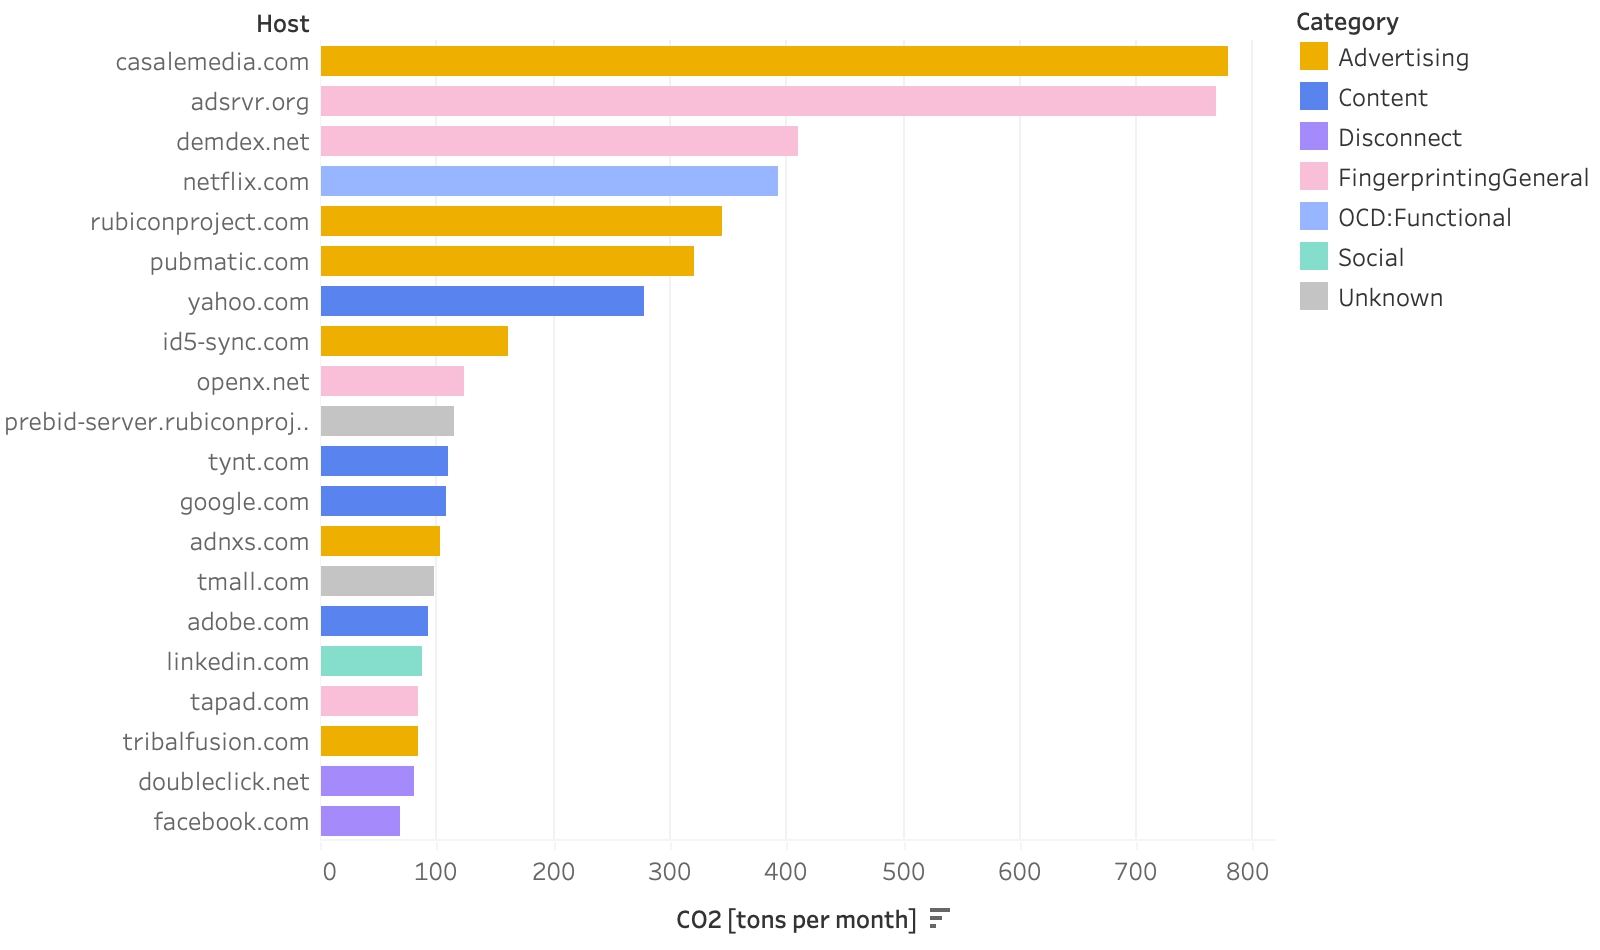
Figure 15. Top 20 hosts by CO2 emissions and usage category of cookies.
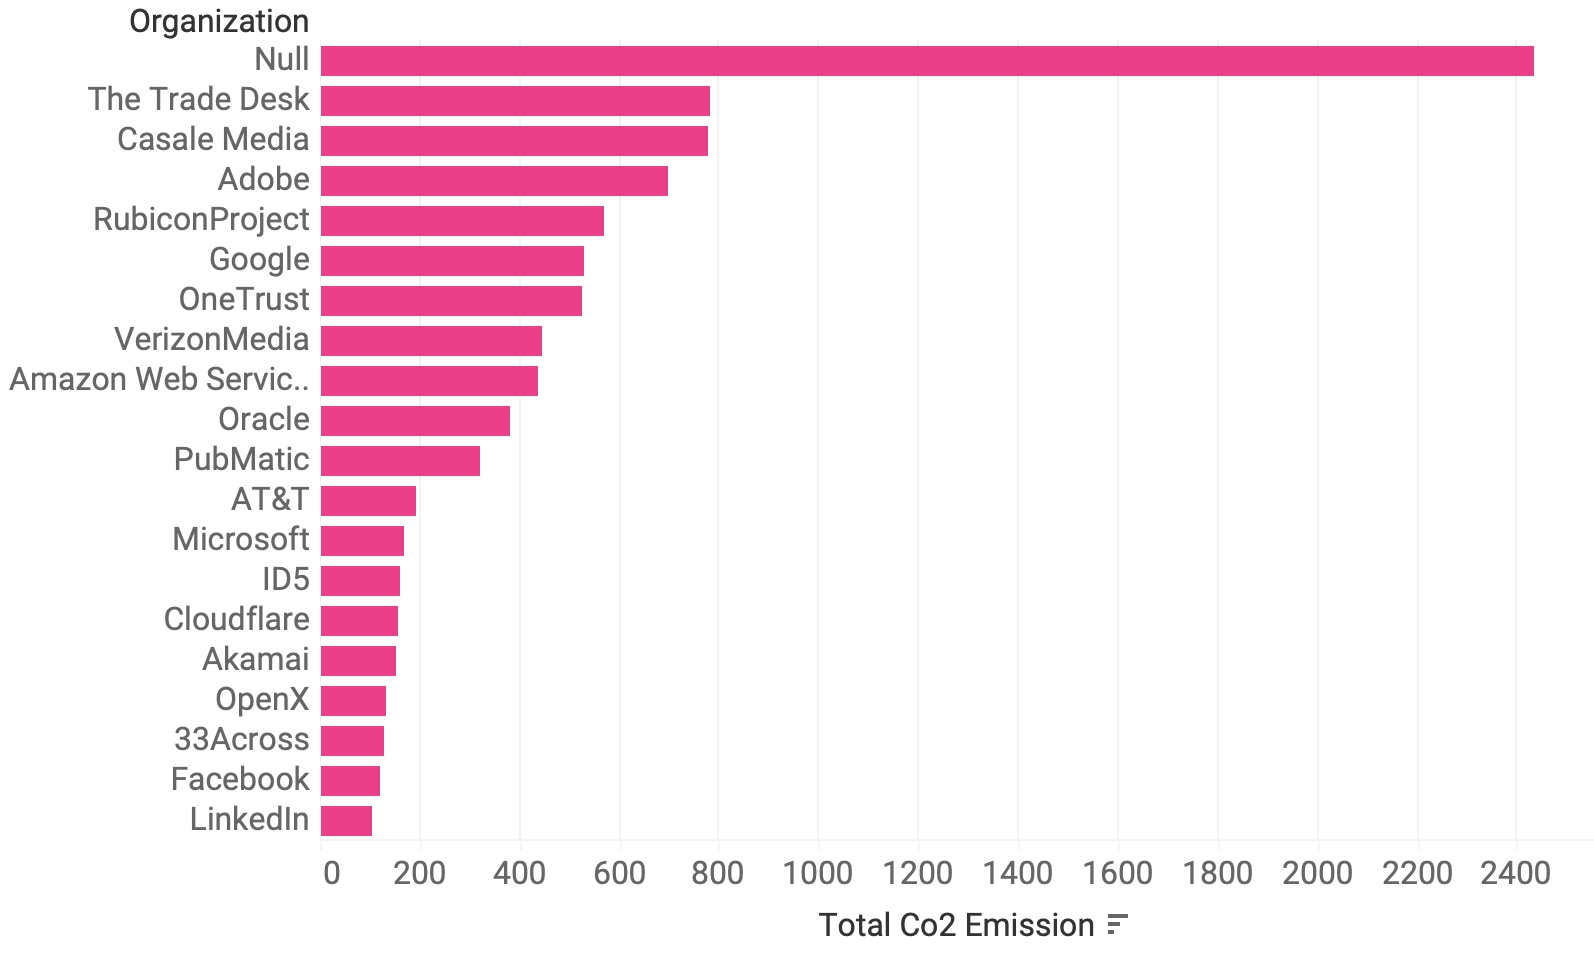
Figure 16. Top 20 organizations by CO2 emissions of their cookies. Null stands for the cookies that we weren’t able to assign to any organization.
6. Discussion and Conclusions
The online advertising system is a huge industry that funds a large part of the internet and the businesses that thrive from it (see the latest image of the advertising ecosystem in Figure 16). As such, online advertising might account for 25% of the total internet bandwidth,[48] and its total energy consumption has been estimated at 11 to 159 million tons of CO2 equivalent.[49] Our estimation of the emissions caused by cookie traffic alone might be a small part of this contribution, but it is the proverbial tip of the iceberg, as the cookies that follow us trigger immense computations that are used for profiling, predictions, biddings and more. Online tracking is an issue not only in terms of personal privacy, but also in terms of social responsibility.
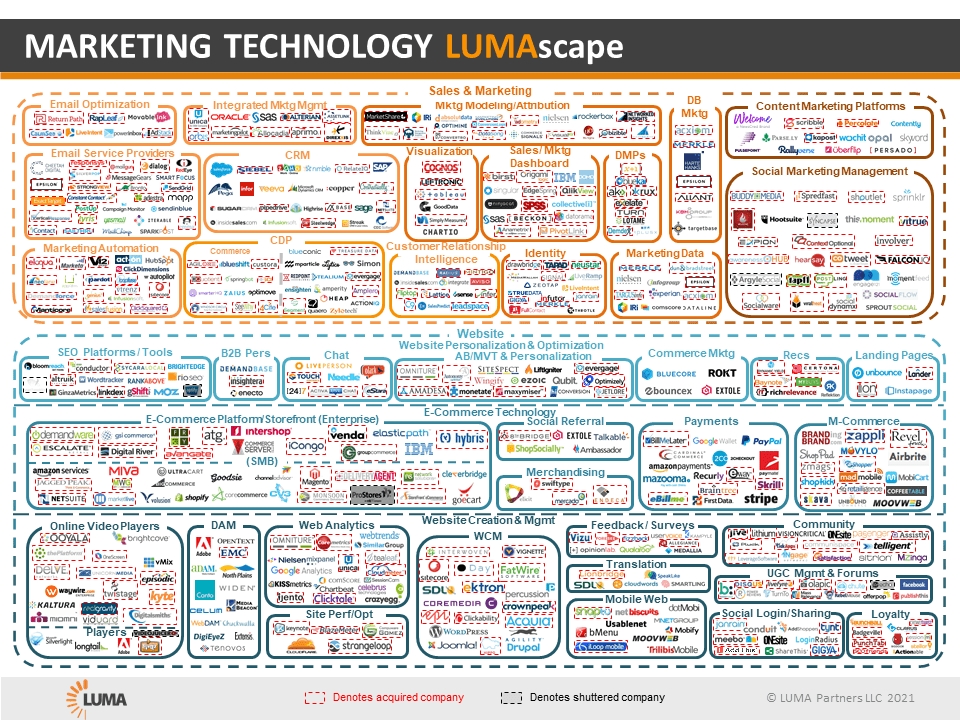
Figure 17. LUMAscape, a representation of the advertising ecosystem.[50]
We expect to continue our work in this line of research and further refine our calculations: for example, we could develop and introduce methods that would allow us to make a more thorough distinction between mobile and desktop clients, or to capture the carbon intensity of technologies in different parts of the world more precisely, or to incorporate more accurate models of the number of pages per site visit. Our technology stack is also amenable to improvements both in its stability and efficiency. But most of all, we hope that our contribution inspires and empowers others to follow this line of work, and it is for this reason that we are openly releasing our full datasets and code repositories.
7. References
[1] Hwang, Tim. 2020. Subprime Attention Crisis : Advertising and the Time Bomb at the Heart of the Internet. New York: Fsg Originals X Logic, Farrar, Straus And Giroux.
[2] Hayes, Dade. 2021. “Advertising’s Robust Recovery This Year Will Be Followed by Double-Digit Gains in 2022, Media Agencies Predict.” Deadline. December 7, 2021. Accessed January 25, 2022. https://www.deadline.com/2021/12/advertising-recovery-2021-covid-forecast-2022-digital-1234885438/.
[3] “Facebook Ad Revenue 2009-2018.” 2021. Statista. February 5, 2021. Accessed January 25, 2022. https://www.statista.com/statistics/271258/facebooks-advertising-revenue-worldwide/
[4] Graham, Megan, and Jennifer Elias. 2021. “How Google’s $150 Billion Advertising Business Works.” CNBC. May 18, 2021. Accessed January 25, 2022. https://www.cnbc.com/2021/05/18/how-does-google-make-money-advertising-business-breakdown-.html.how-does-google-make-money-advertising-business-breakdown-.html
[5] Adgate, Brad. 2021. “Agencies Agree; 2021 Was a Record Year for Ad Spending, with More Growth Expected in 2022.” Forbes. December 8, 2021. Accessed January 26, 2022. https://www.forbes.com/sites/bradadgate/2021/12/08/agencies-agree-2021-was-a-record-year-for-ad-spending-with-more-growth-expected-in-2022/.
[6] Simons, R J G, and Aiko Pras. 2010. The Hidden Energy Cost of Web Advertising. Centre For Telematics And Information Technology (CTIT).
[7] Christl, Wolfie, and Sarah Spiekermann. 2016. Networks of Control. A Report on Corporate Surveillance, Digital Tracking, Big Data & Privacy. Crackedlabs.org. Facultas. https://crackedlabs.org/en/networksofcontrol.
[8] “General Data Protection Regulation.” 2022. Wikipedia. February 9, 2022. Accessed February 9, 2022https://en.wikipedia.org/w/index.php?title=General_Data_Protection_Regulation&oldid=1070853460.
[9] “California Consumer Privacy Act.” 2022. Wikipedia. January 16, 2022. Accessed February 9, 2022. https://en.wikipedia.org/w/index.php?title=California_Consumer_Privacy_Act&oldid=1066008092.
[10] “Raising the Standard for Connected Products, Services and Systems.” n.d. Thedigitalstandard.org. Accessed February 9, 2022. https://thedigitalstandard.org/.
[11] “Firefox Lightbeam.” 2022. GitHub. January 25, 2022. https://github.com/mozilla/lightbeam-we.
[12] Englehardt, Steven, and Arvind Narayanan. 2016a. “Online Tracking.” Proceedings of the 2016 ACM SIGSAC Conference on Computer and Communications Security, October, 1388–1401. https://doi.org/10.1145/2976749.2978313.
[13] “Carbon Footprint of Unwanted Data-Use by Smartphones. An Analysis for the EU.” n.d. CE Delft - EN. Accessed February 14, 2022. https://cedelft.eu/publications/carbon-footprint-of-unwanted-data-use-by-smartphones-an-analysis-for-the-eu/.
[14] “A Research-Oriented Top Sites Ranking Hardened against Manipulation - Tranco.” n.d. Tranco-List.eu. https://tranco-list.eu/.
[15] “Borda Count.” 2022. Wikipedia. February 2, 2022. https://en.wikipedia.org/wiki/Borda_count#Dowdall_system_(Nauru).
[16] Adamic, Lada, and Bernardo Huberman. 2002. “Zipf’s Law and the Internet.” Glottometrics, no. 3: 143–50.
[17] “OpenWPM.” 2021. GitHub. December 31, 2021. https://github.com/openwpm/OpenWPM.
[18] Surprisingly, we did collect cookies from many sites without giving consent, even in places with the GDPR modal installed. This behaviour (storing cookies before consent) can also be seen manually through the developer console in browsers.
[19] “ProtonVPN: Secure and Free VPN Service for Protecting Your Privacy.” n.d. ProtonVPN. https://protonvpn.com.
[20] “Docker Hub.” n.d. Hub.docker.com. Accessed February 14, 2022. https://hub.docker.com/r/qmcgaw/gluetun.
[21] “Docker Hub.” n.d. Hub.docker.com. https://hub.docker.com/_/postgres.
[22] Englehardt & Narayanan, 2016.
[23] Figures from Mozilla documentation: Using HTTP cookies. (n. d.). MDN Web Docs. Retrieved February 9, 2022, from https://developer.mozilla.org/en-US/docs/Web/HTTP/Cookies
[24] “HTTP Cookies.” 2019. MDN Web Docs. August 5, 2019. Accessed February 9, 2022. https://developer.mozilla.org/en-US/docs/Web/HTTP/Cookies.
[25] Clement, J. 2021. “Global Top Websites by Monthly Visits 2020.” Statista. September 7, 2021. Accessed February 9, 2022. https://www.statista.com/statistics/1201880/most-visited-websites-worldwide/.
[26] “Google.com Traffic Statistics.” n.d. SimilarWeb. Accessed February 9, 2022. https://www.similarweb.com/website/google.com/#overview.
[27] “Top 100: The Most Visited Websites in the US [2021 Top Websites Edition].” n.d. Www.semrush.com. Accessed February 9, 2022. https://www.semrush.com/blog/most-visited-websites/.
[28] “Website Ranking: Top 50 Most Visited Websites Ranked - SimilarWeb.” 2021. Www.similarweb.com. December 2021. Accessed February 9, 2022. https://www.similarweb.com/top-websites/.
[29] “Littledata.” 2022. Www.littledata.io. February 2022. Accessed February 9, 2022. https://www.littledata.io/average/pages-per-session-(all-devices). new refs -->
[30] Koomey and Masanet, Does not compute: Avoiding pitfalls assessing the Internet’s energy and carbon impacts, Joule (2021), https://doi.org/10.1016/j.joule.2021.05.007
[31] Aslan J, Mayers K, Koomey JG, France C. Electricity intensity of internet data transmission: untangling the estimates. J Ind Ecol. 2018;22:785– 98
[32] Recalibrating global data center energy-use estimates, Eric Masanet, Arman Shehabi, Nuoa Lei, Sarah Smith, Jonathan Koomey, Science, 28 Feb 2020, Vol 367 issue 6481
[33] Cisco. 2016. “VNI Complete Forecast Highlights Global Internet Users: % of Population Devices and Connections per Capita Average Speeds Average Traffic per Capita per Month Global -2021 Forecast Highlights IP Traffic.” Accessed February 9, 2022. https://www.cisco.com/c/dam/m/en_us/solutions/service-provider/vni-forecast-highlights/pdf/Global_2021_Forecast_Highlights.pdf.
[34] Alsop, Thomas. “Desktop PCs Replacement Cycle in the US 2018-2024.” Statista, 1 Feb. 2022, www.statista.com/statistics/267465/average-desktop-pc-lifespan/. Accessed 9 Feb. 2022.
[35] Coroama V.C., Schien D., Preist C., Hilty L.M. (2015) The Energy Intensity of the Internet: Home and Access Networks. In: Hilty L., Aebischer B. (eds) ICT Innovations for Sustainability. Advances in Intelligent Systems and Computing, vol 310. Springer, Cham. https://doi.org/10.1007/978-3-319-09228-7_8
[36] Andrae, Anders, and Tomas Edler. 2015. “On Global Electricity Usage of Communication Technology: Trends to 2030.” Challenges 6 (1): 117–57. https://doi.org/10.3390/challe6010117.
[37] Wikipedia Contributors. “Fermi Problem.” Wikipedia, Wikimedia Foundation, 31 Oct. 2019, en.wikipedia.org/wiki/Fermi_problem. Accessed 8 Feb. 2022.
[38] International Energy Agency. 2019. “Emissions – Global Energy & CO2 Status Report 2019 – Analysis.” IEA. March 2019. Accessed February 9, 2022. https://www.iea.org/reports/global-energy-co2-status-report-2019/emissions.
[39] European Environment Agency. 2021. “Greenhouse Gas Emission Intensity of Electricity Generation in Europe.” Www.eea.europa.eu. November 18, 2021. Accessed February 9, 2022. https://www.eea.europa.eu/ims/greenhouse-gas-emission-intensity-of-1.
[40] Pehl, Michaja, Anders Arvesen, Florian Humpenöder, Alexander Popp, Edgar G. Hertwich, and Gunnar Luderer. 2017. “Understanding Future Emissions from Low-Carbon Power Systems by Integration of Life-Cycle Assessment and Integrated Energy Modelling.” Nature Energy 2 (12): 939–45. https://doi.org/10.1038/s41560-017-0032-9.
[41] “Home.” n.d. The Green Web Foundation. Accessed February 14, 2022. https://www.thegreenwebfoundation.org/.
[42] “How Does It Work?” n.d. Website Carbon Calculator. Accessed February 9, 2022. https://www.websitecarbon.com/how-does-it-work/.
[43] Ecotricity. n.d. “Our Environmental Footprint.” Accessed February 9, 2022. https://www.ecotricity.co.uk/our-story/our-environmental-footprint.
[44] Disconnect. 2021. “Disconnectme/Disconnect-Tracking-Protection.” GitHub. 2021. Accessed February 9, 2022. https://github.com/disconnectme/disconnect-tracking-protection.
[45] Kwakman, Jack. “Open-Cookie-Database.” GitHub, github.com/jkwakman/Open-Cookie-Database. Accessed 9 Feb. 2022.
[46] “Using Cookiepedia | Cookiepedia.” n.d. Cookiepedia.co.uk. Accessed February 9, 2022. https://cookiepedia.co.uk/using-cookiepedia.
[47] One particular site had two cookies that were updated over 22 thousand times during our 90-second crawl, most likely due to some kind of bug or strange interaction between the site and the browser.
[48] Parmar, Arvind, Costa Dedegikas, Malcolm Toms, and Christopher Dickert. 2015. “Adblock plus Efficacy Study.” https://www.sfu.ca/content/dam/sfu/snfchs/pdfs/Adblock.Plus.Study.pdf.
[49] Pärssinen, M., M. Kotila, R. Cuevas, A. Phansalkar, and J. Manner. 2018. “Environmental Impact Assessment of Online Advertising.” Environmental Impact Assessment Review 73 (November): 177–200. Accessed February 9, 2022. https://doi.org/10.1016/j.eiar.2018.08.004.
[50] “Marketing Technology LUMAscape | LUMA Partners.” n.d. Lumapartners.com. https://lumapartners.com/content/lumascapes/martech-lumascape/.
[51] Goel, V. 2021. “An Updated Timeline for Privacy Sandbox Milestones.” Google. June 24, 2021. Accessed February 9, 2022. https://blog.google/products/chrome/updated-timeline-privacy-sandbox-milestones/.
[52] “The Privacy Sandbox: Technology for a More Private Web.” n.d. https://privacysandbox.com/.
[53] Chen, et al. "Cookies: HTTP State Management Mechanism." October 2021. Accessed February 9, 2022. draft-ietf-httpbis-rfc6265bis-09 https://datatracker.ietf.org/doc/html/draft-ietf-httpbis-rfc6265bis-09#page-45
[54] Marotta, Veronica, Vibhanshu Abhishek, and Alessandro Acquisti. 2019. “Online Tracking and Publishers’ Revenues: An Empirical Analysis.” Accessed February 9, 2022. https://weis2019.econinfosec.org/wp-content/uploads/sites/6/2019/05/WEIS_2019_paper_38.pdf.
8. Acknowledgements
Carbolytics is a project at the intersection of art and research by artist Joana Moll, commissioned by Aksioma, in collaboration with the Barcelona Supercomputing Center, and in partnership with Weizenbaum Institute and Sónar +D.
Infographics Luz Calvo, Sol Bucalo & Diana Vélez
Copyediting Miha Šuštar
Special thanks to Marcela Okretič, Janez Janša, for their generosity throughout the process, and Astrid Rousse and Antònia Folguera for their kind support during the production of this project. Also, to Patricio Reyes, Arnau Folch, Daniel Irrgang, Matthew Fuller, Marta Peirano, Bianca Herlo, Marta Millet, Ramin Soleymani, Claudio Guarnieri, Marta Gràcia, Eugenio Tisselli, and Panoptikon for their incredibly valuable thoughts and inputs.
In the framework of konS – Platform for Contemporary Investigative Art
The project konS: Platform for Contemporary Investigative Art was chosen on the public call for the selection of the operations “Network of Investigative Art and Culture Centres”. The investment is co-financed by the Republic of Slovenia and by the European Regional Development Fund of the European Union.